
De la hausse des prix des carburants et des produits alimentaires, à l'inflation et aux perturbations de la chaîne d'approvisionnement, la guerre russo-ukrainienne a pesé sur les économies et les systèmes alimentaires de l'Afrique, avec des conséquences diverses pour les populations rurales et urbaines dans les différents secteurs des produits de base. L'intensification du conflit entre l'Ukraine et la Russie en février 2022 a perturbé les chaînes d'approvisionnement mondiales de produits agricoles et alimentaires, qui commençaient à peine à se remettre des chocs provoqués par le COVID-19.
En réponse au conflit et à son impact sur les pays africains, AKADEMIYA2063 mène des recherches pour fournir des simulations basées sur des données probantes des ramifications de la crise. S'appuyant sur des données, des analyses et des modèles de crises précédentes, la série de notes sur la crise ukrainienne d'AKADEMIYA2063 analyse les impacts économiques et socio-économiques des perturbations du marché mondial induites par le conflit entre la Russie et l'Ukraine.L'analyse approfondie des scientifiques d'AKADEMIYA2063 porte principalement sur (1) les effets des perturbations du marché mondial sur les termes de l'échange des pays, les impacts résultants sur la croissance économique et l'emploi, ainsi qu'une analyse des effets sur la pauvreté et la sécurité alimentaire, (2) les effets sectoriels de la crise, couvrant les perturbations dans les secteurs du blé, des huiles végétales et des engrais et leurs effets sur les revenus, l'inflation et la sécurité alimentaire, et (3) la transmission des chocs des prix mondiaux des produits de base aux marchés locaux, soulignant les opportunités d'expansion du commerce régional. Les résultats de ces recherches sont publiés sur le portail de la crise ukrainienne d'AKADEMIYA2063.
Avec une analyse globale du continent, la série traite également d'études de cas spécifiques à certains pays, notamment l'Algérie, l'Égypte, le Kenya, le Malawi, le Maroc, le Mozambique, le Rwanda, la Tunisie, l'Ouganda, l'Afrique du Sud, la Zambie et le Zimbabwe.
Publications


Maps and graphs
Weekly wheat export prices, US market, US Dollar/tonne
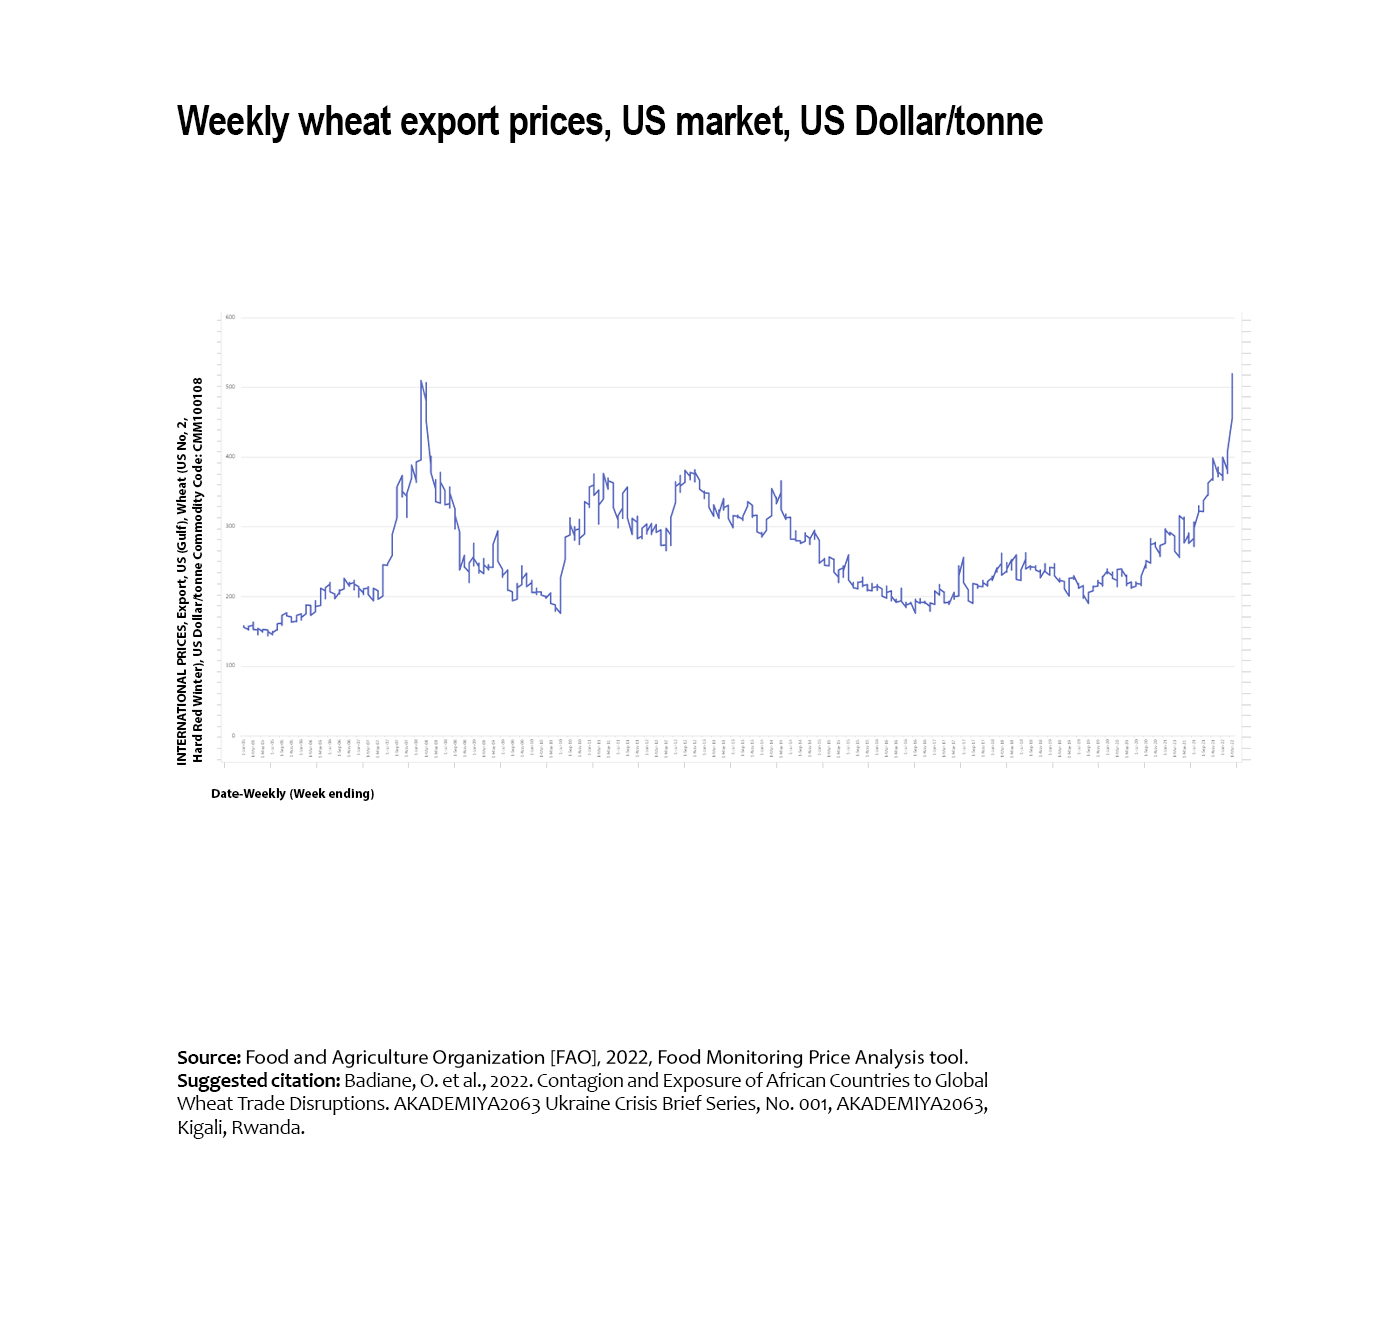
Weekly wheat export prices, US market, US Dollar/tonne
Dependency on wheat imports from Ukraine, Belarus, and Russia (UBR)...
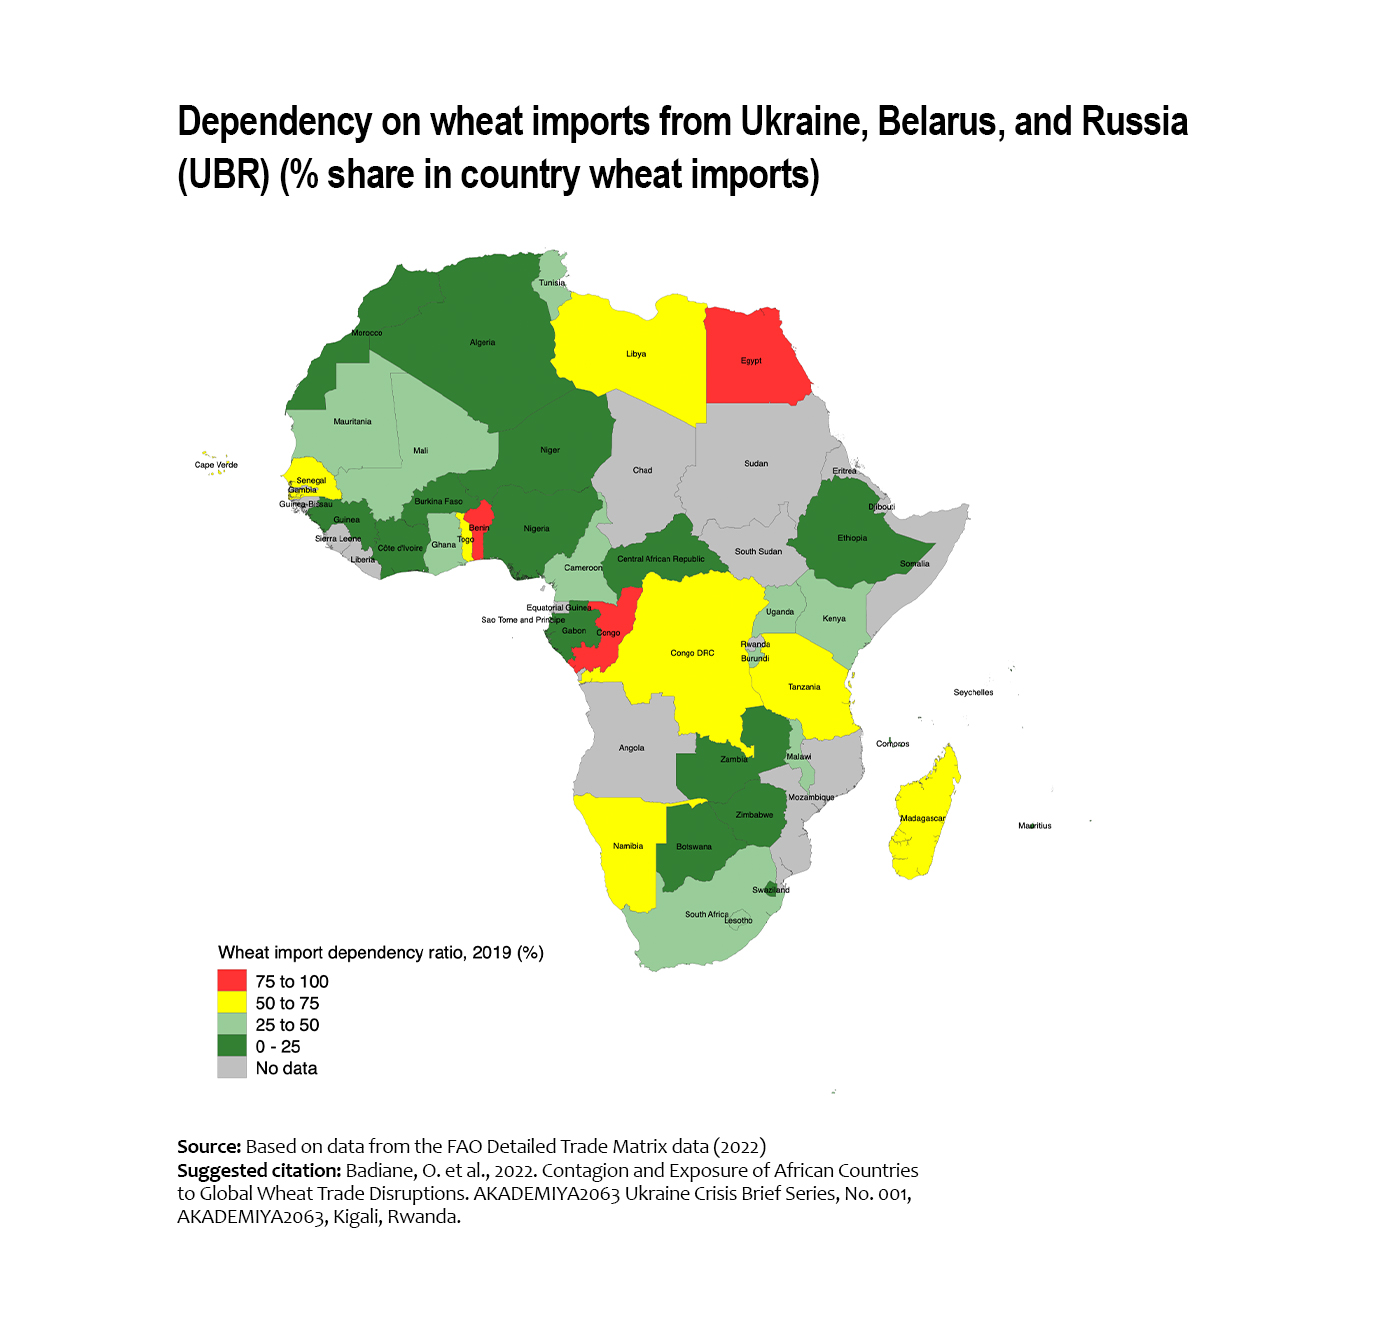
Dependency on wheat imports from Ukraine, Belarus, and Russia (UBR) (% share in country wheat imports)
Wheat import penetration rate (Imports/Domestic Consumption, %)
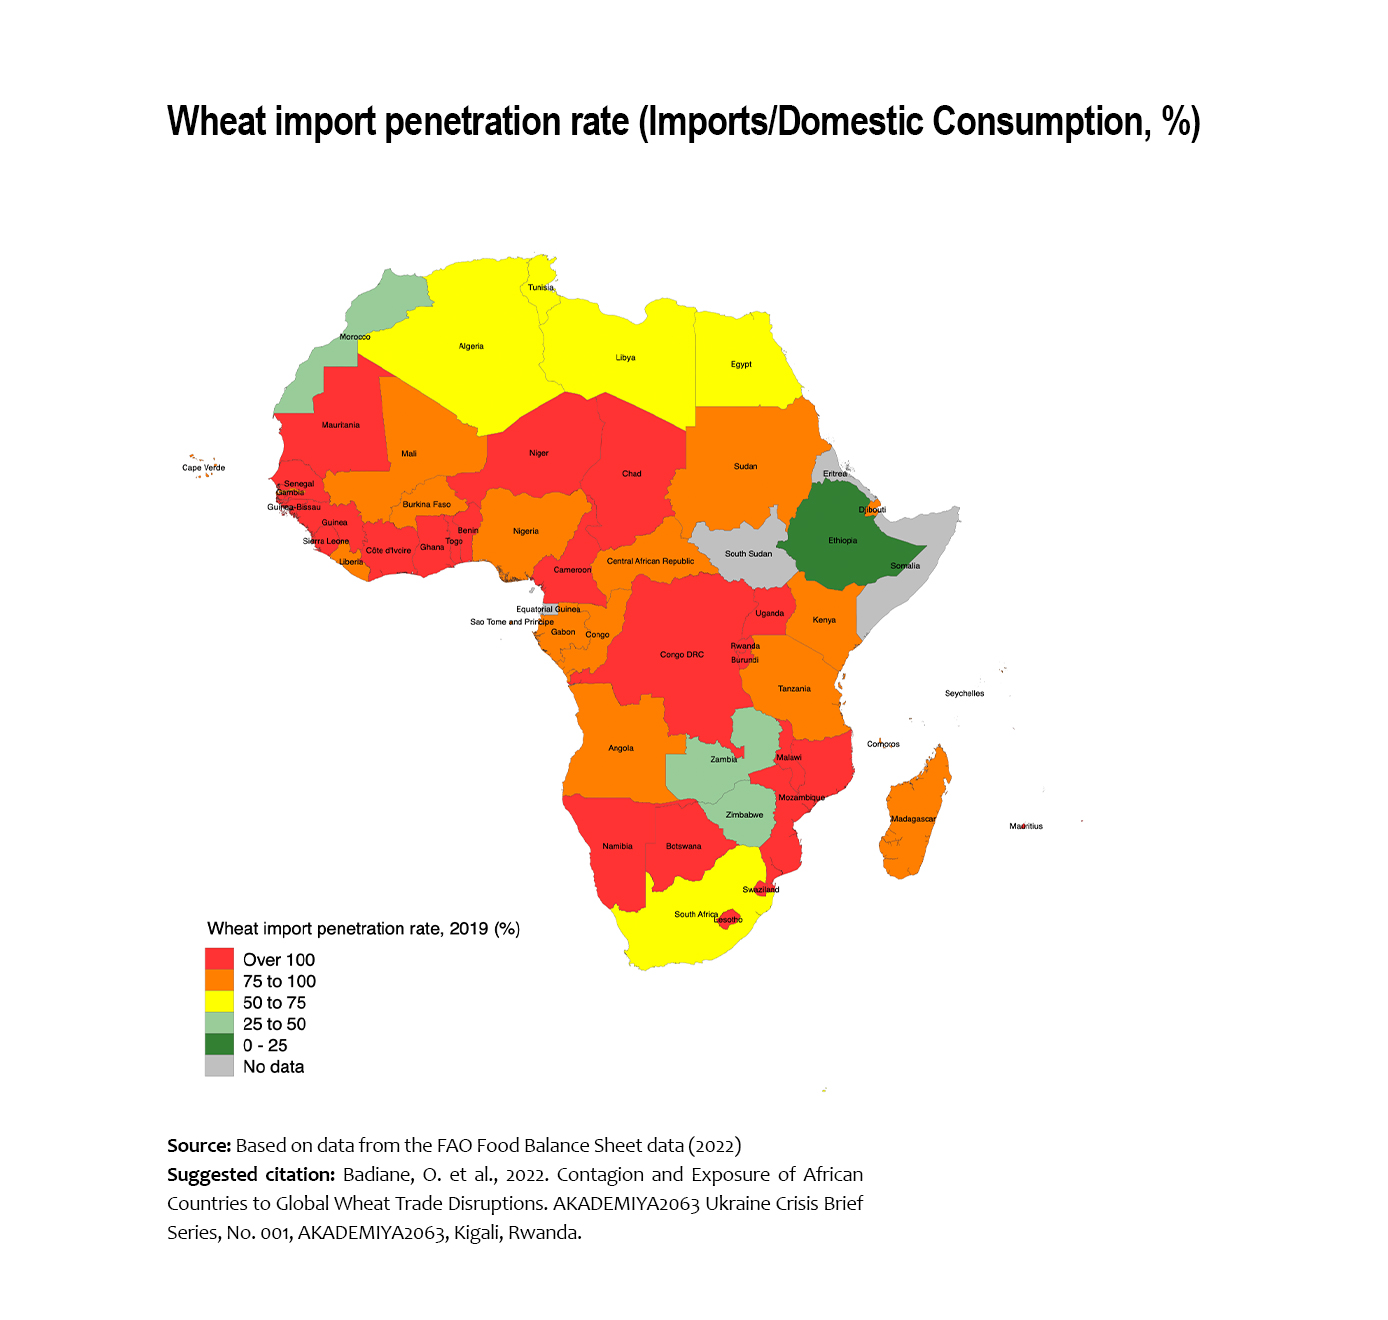
Wheat import penetration rate (Imports/Domestic Consumption, %)
Intra-regional wheat re-export flows in million US dollars, 2019
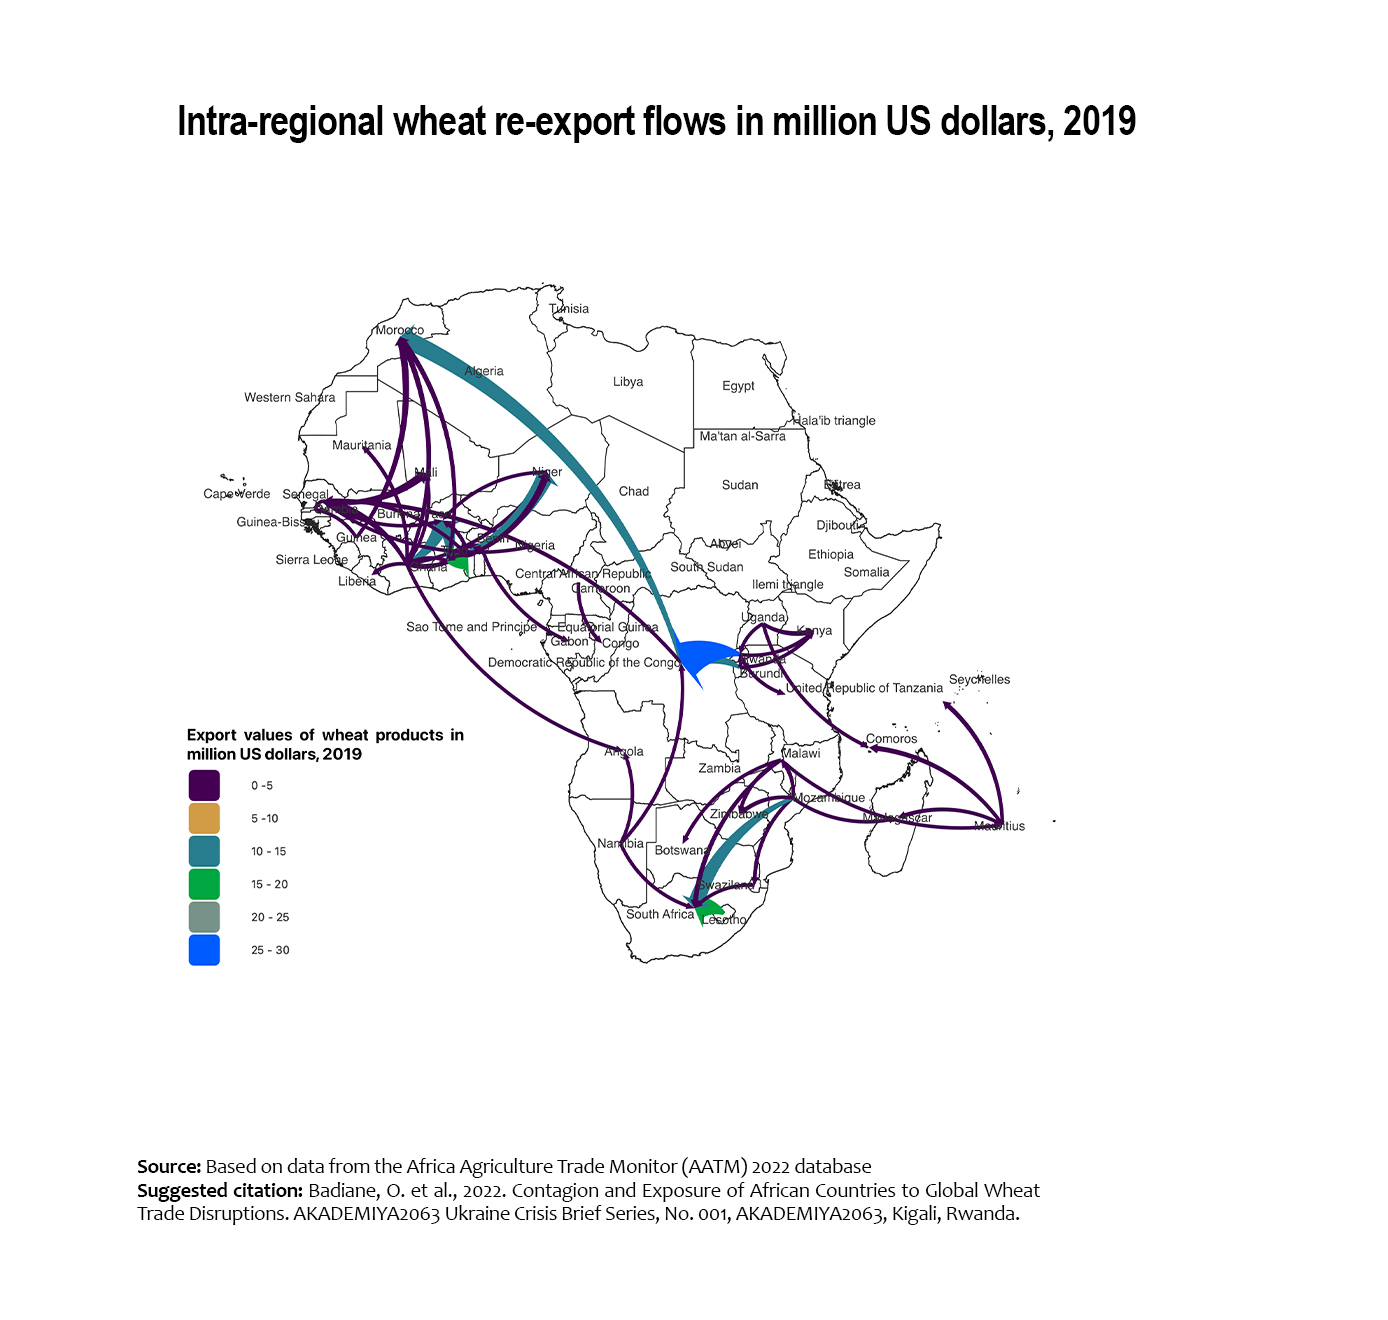
Intra-regional wheat re-export flows in million US dollars, 2019
Intra-regional wheat re-export flows in West Africa in million US dollars, 2019
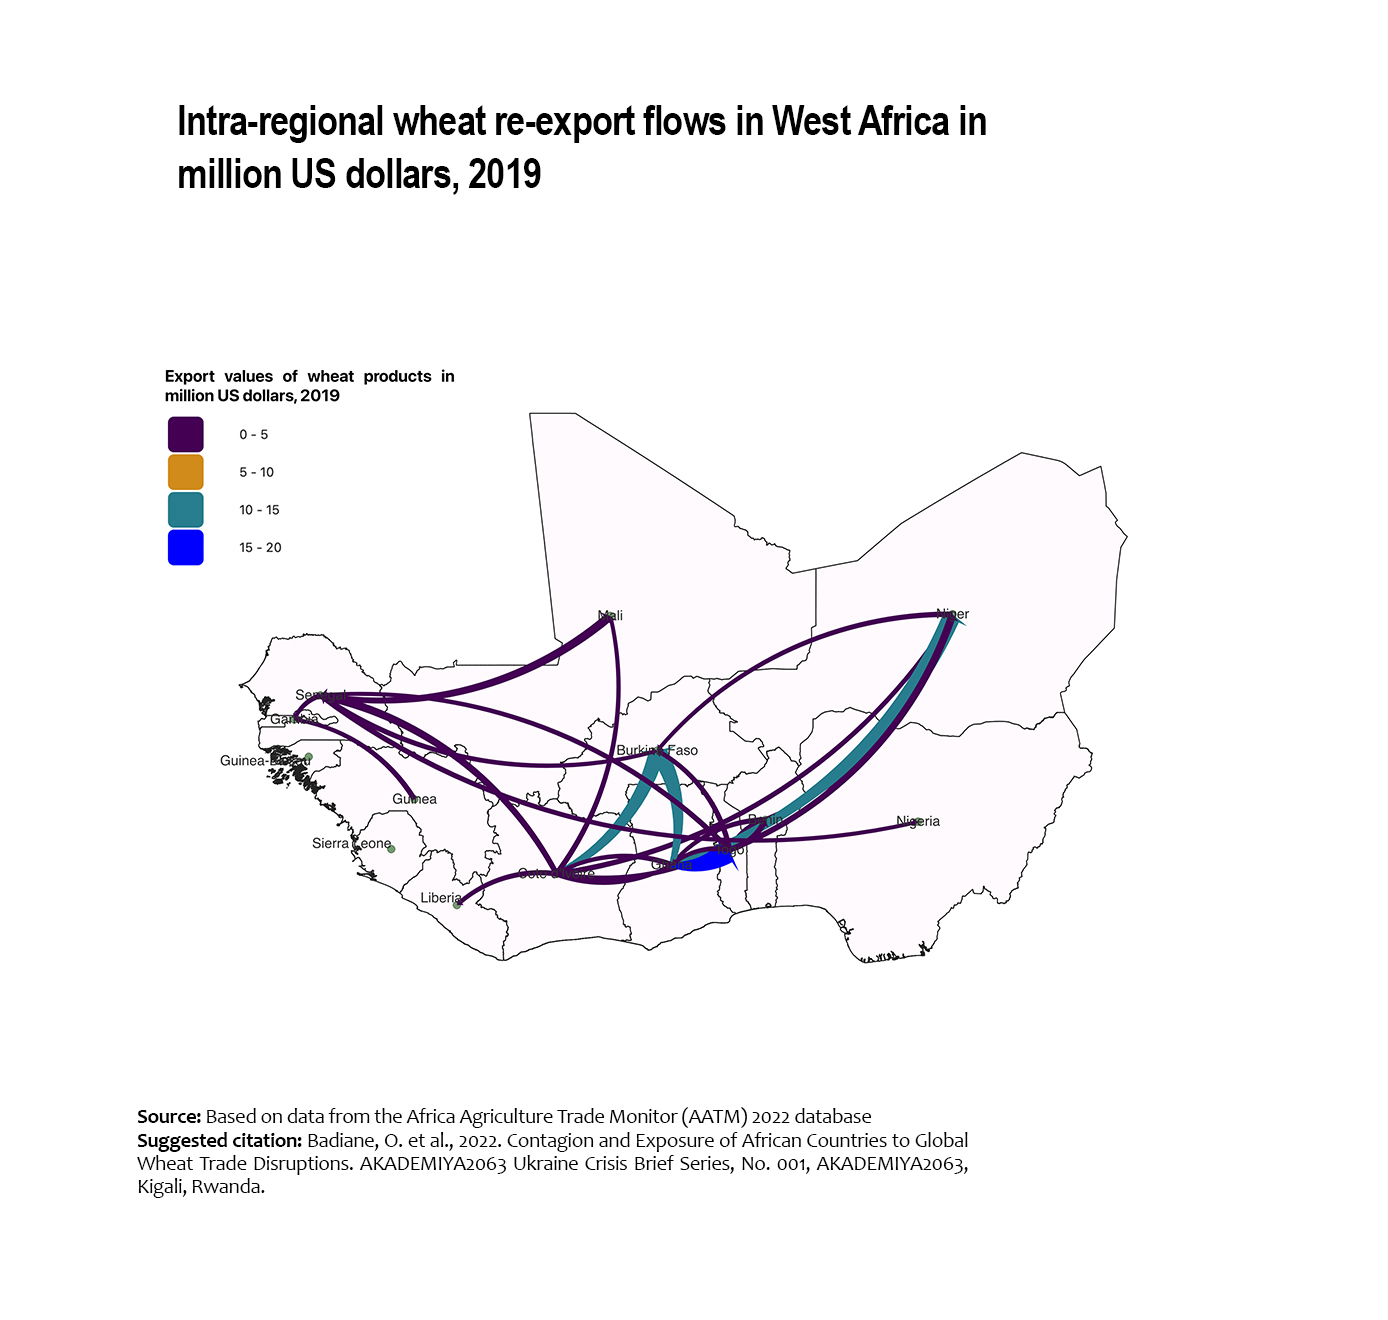
Intra-regional wheat re-export flows in West Africa in million US dollars, 2019
Fertilizer Price, Percentage Annual Changes
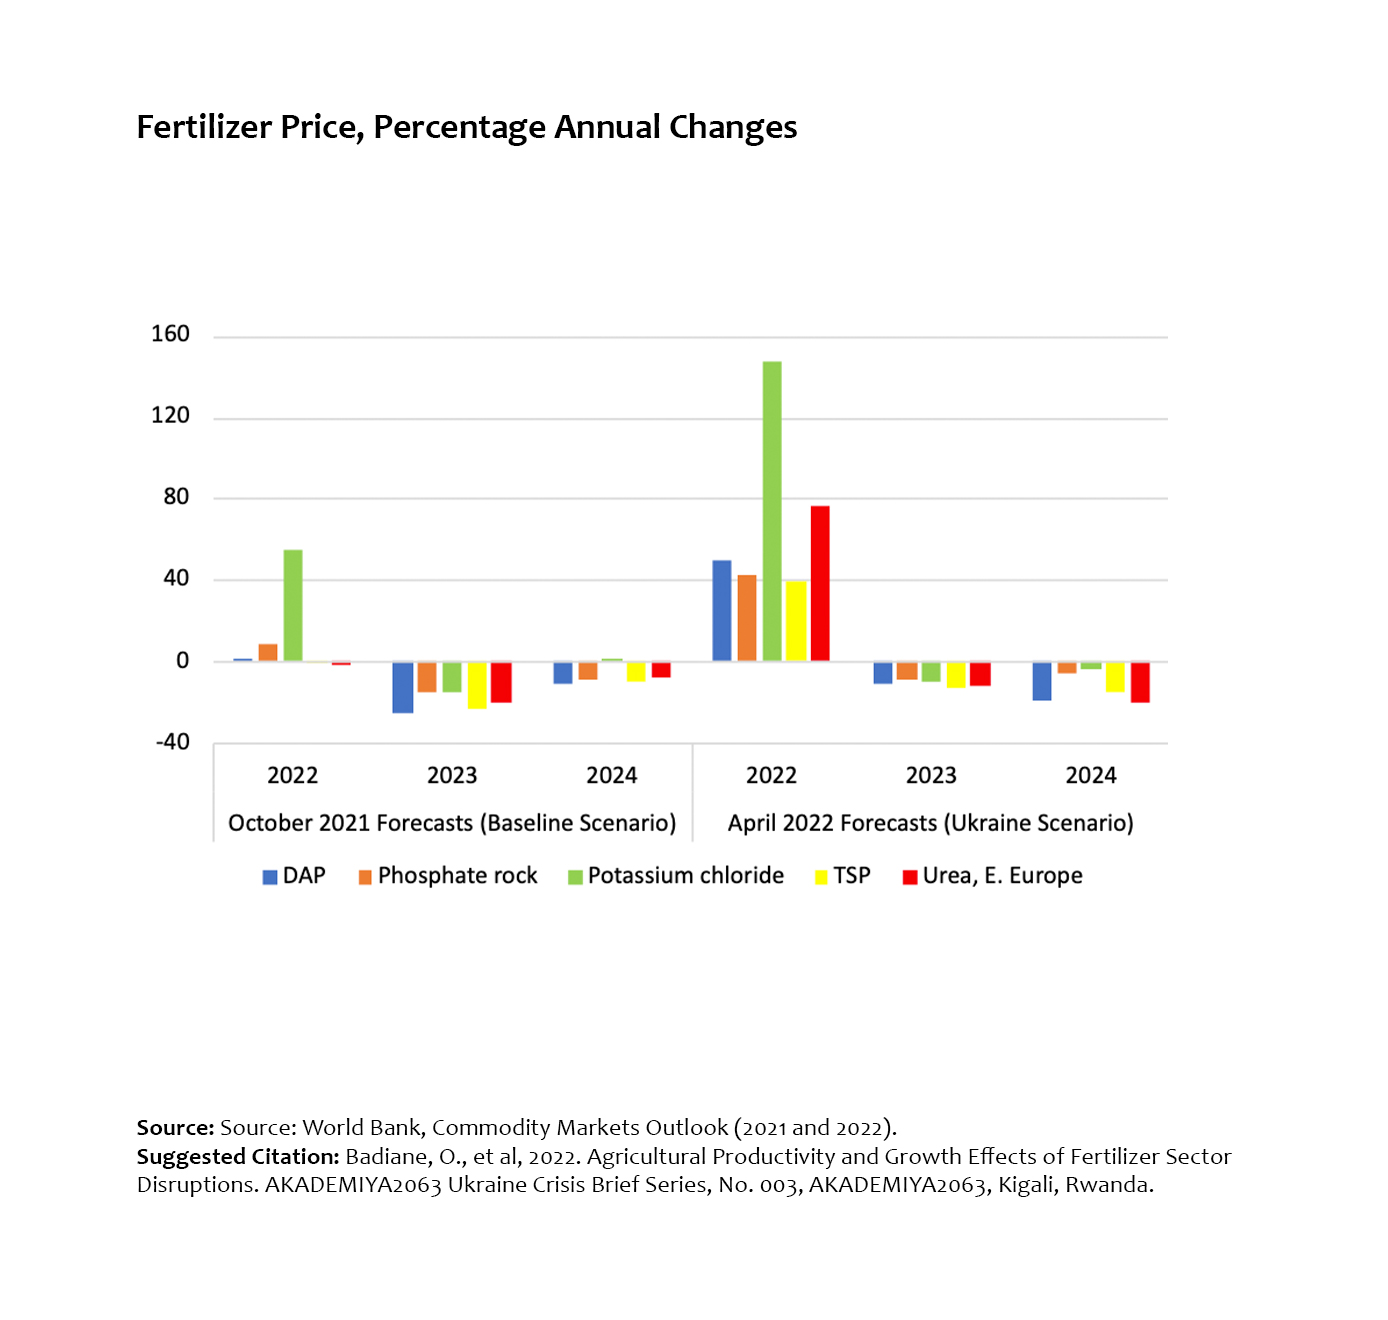
Fertilizer Price, Percentage Annual Changes
Fertilizer Use Share by Crop Type, Ghana
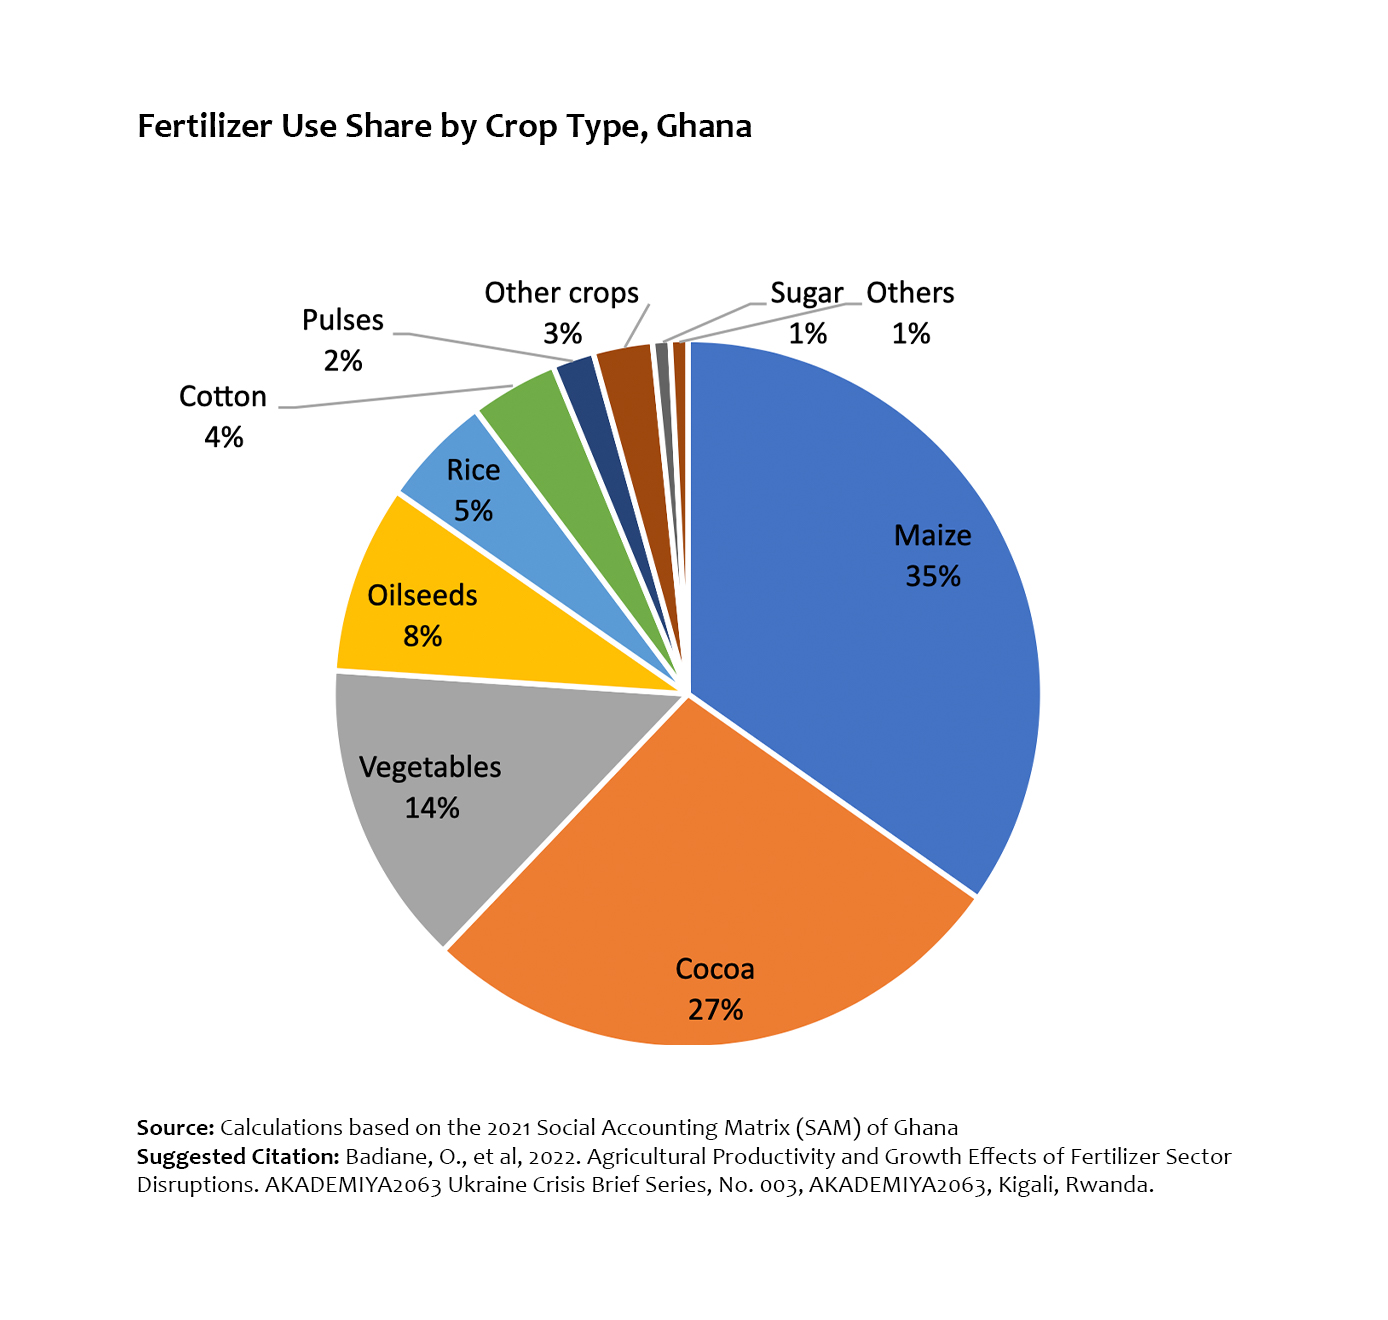
Fertilizer Use Share by Crop Type, Ghana
Fertilizer Use Share by Crop Type, Kenya
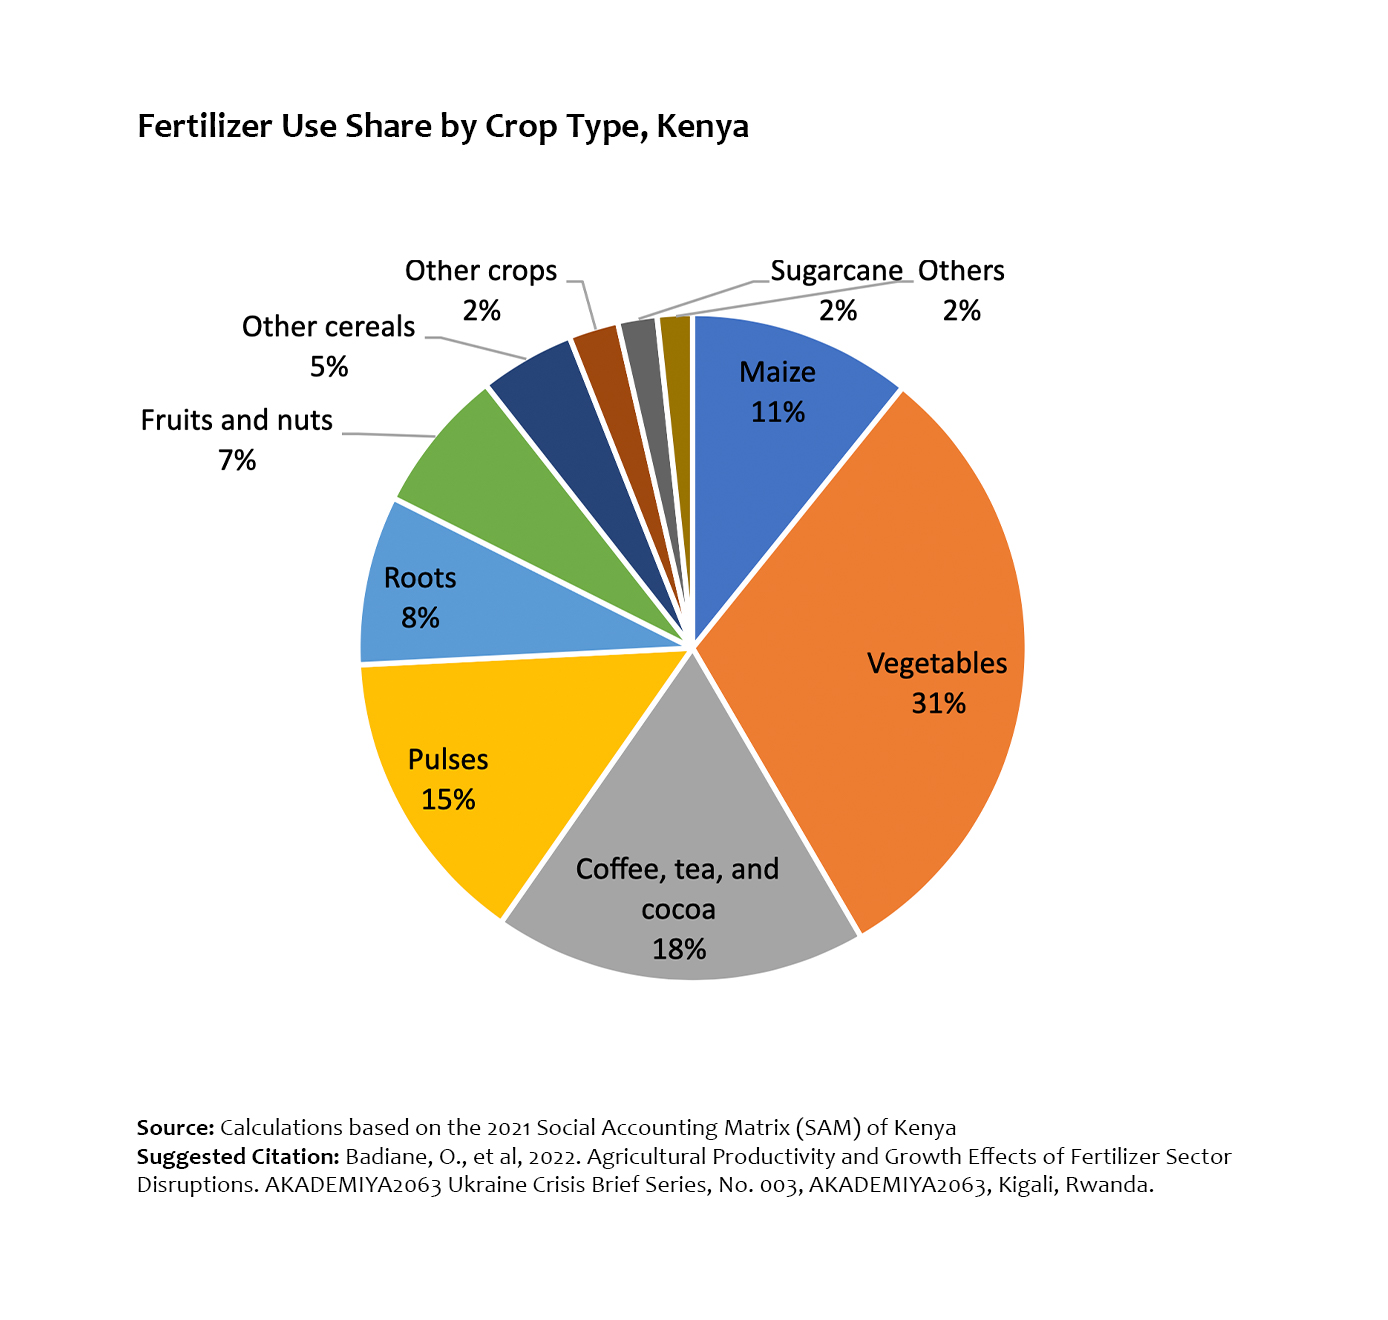
Fertilizer Use Share by Crop Type, Kenya
Fertilizer Use Share by Crop Type, Malawi
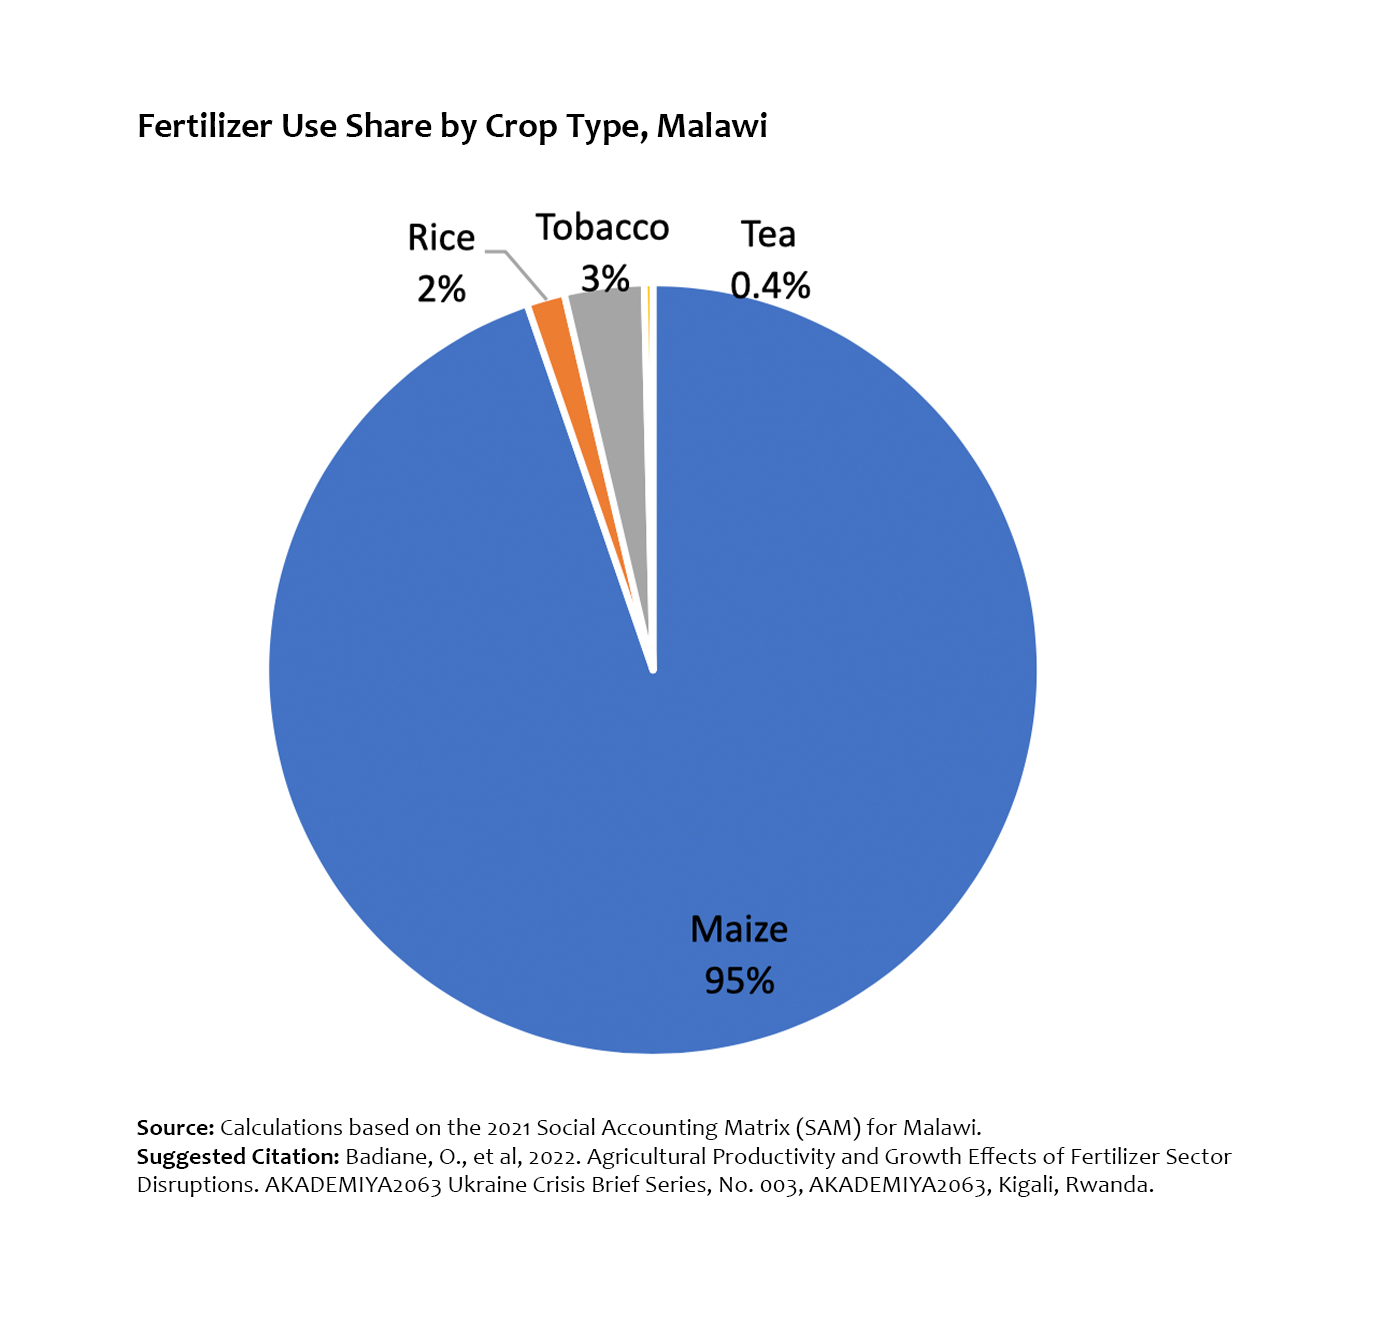
Fertilizer Use Share by Crop Type, Malawi
Fertilizer Use Share by Crop Type, Mozambique
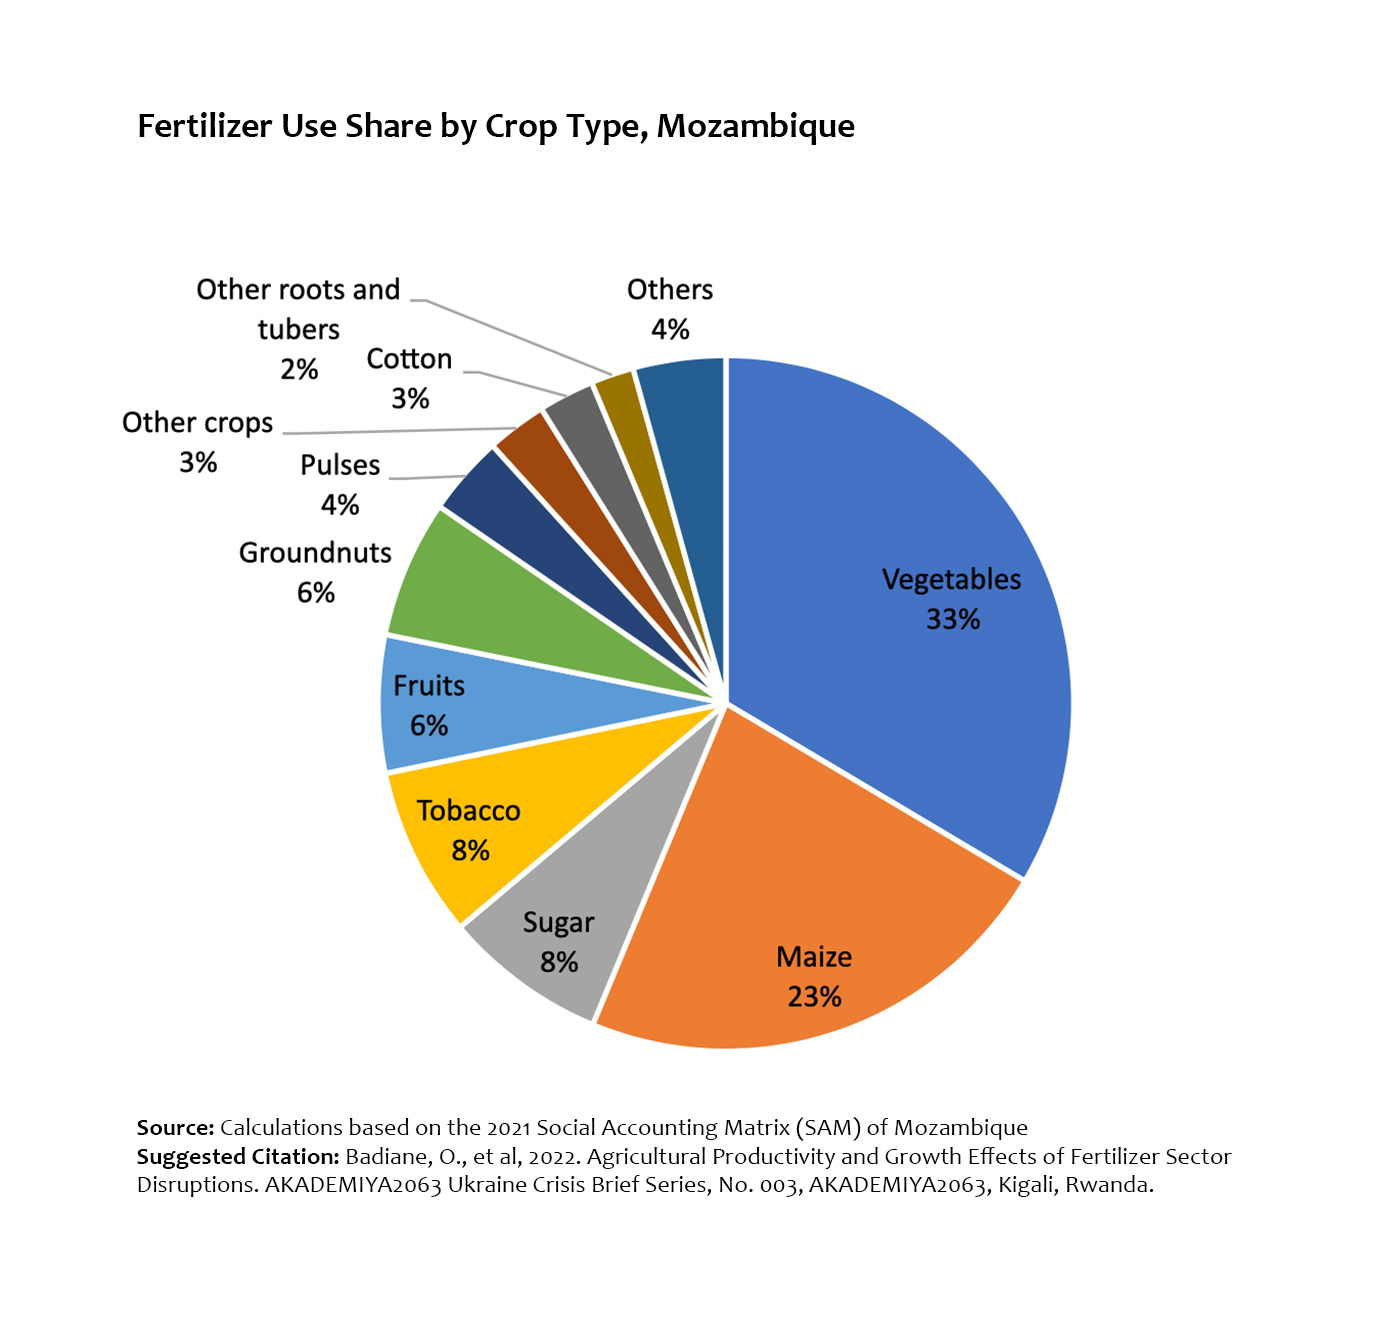
Fertilizer Use Share by Crop Type, Mozambique
Fertilizer Use Share by Crop Type, Nigeria
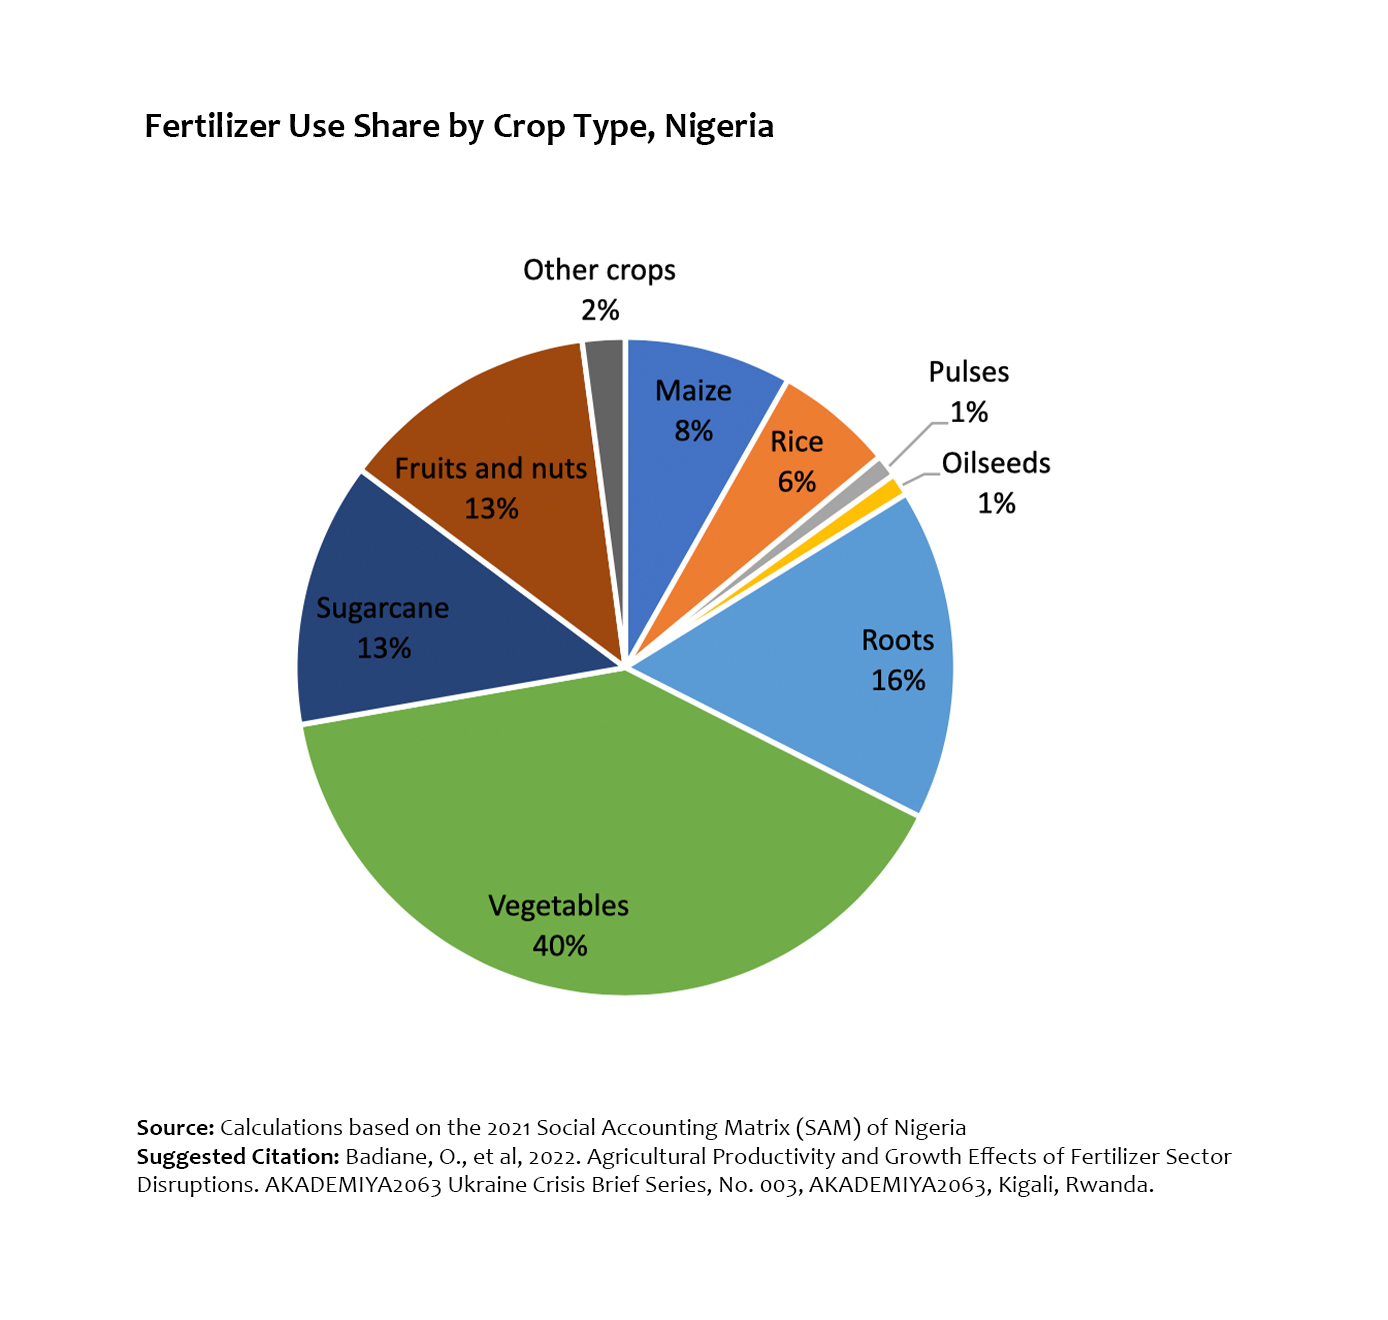
Fertilizer Use Share by Crop Type, Nigeria
Fertilizer Use Share by Crop Type, Senegal
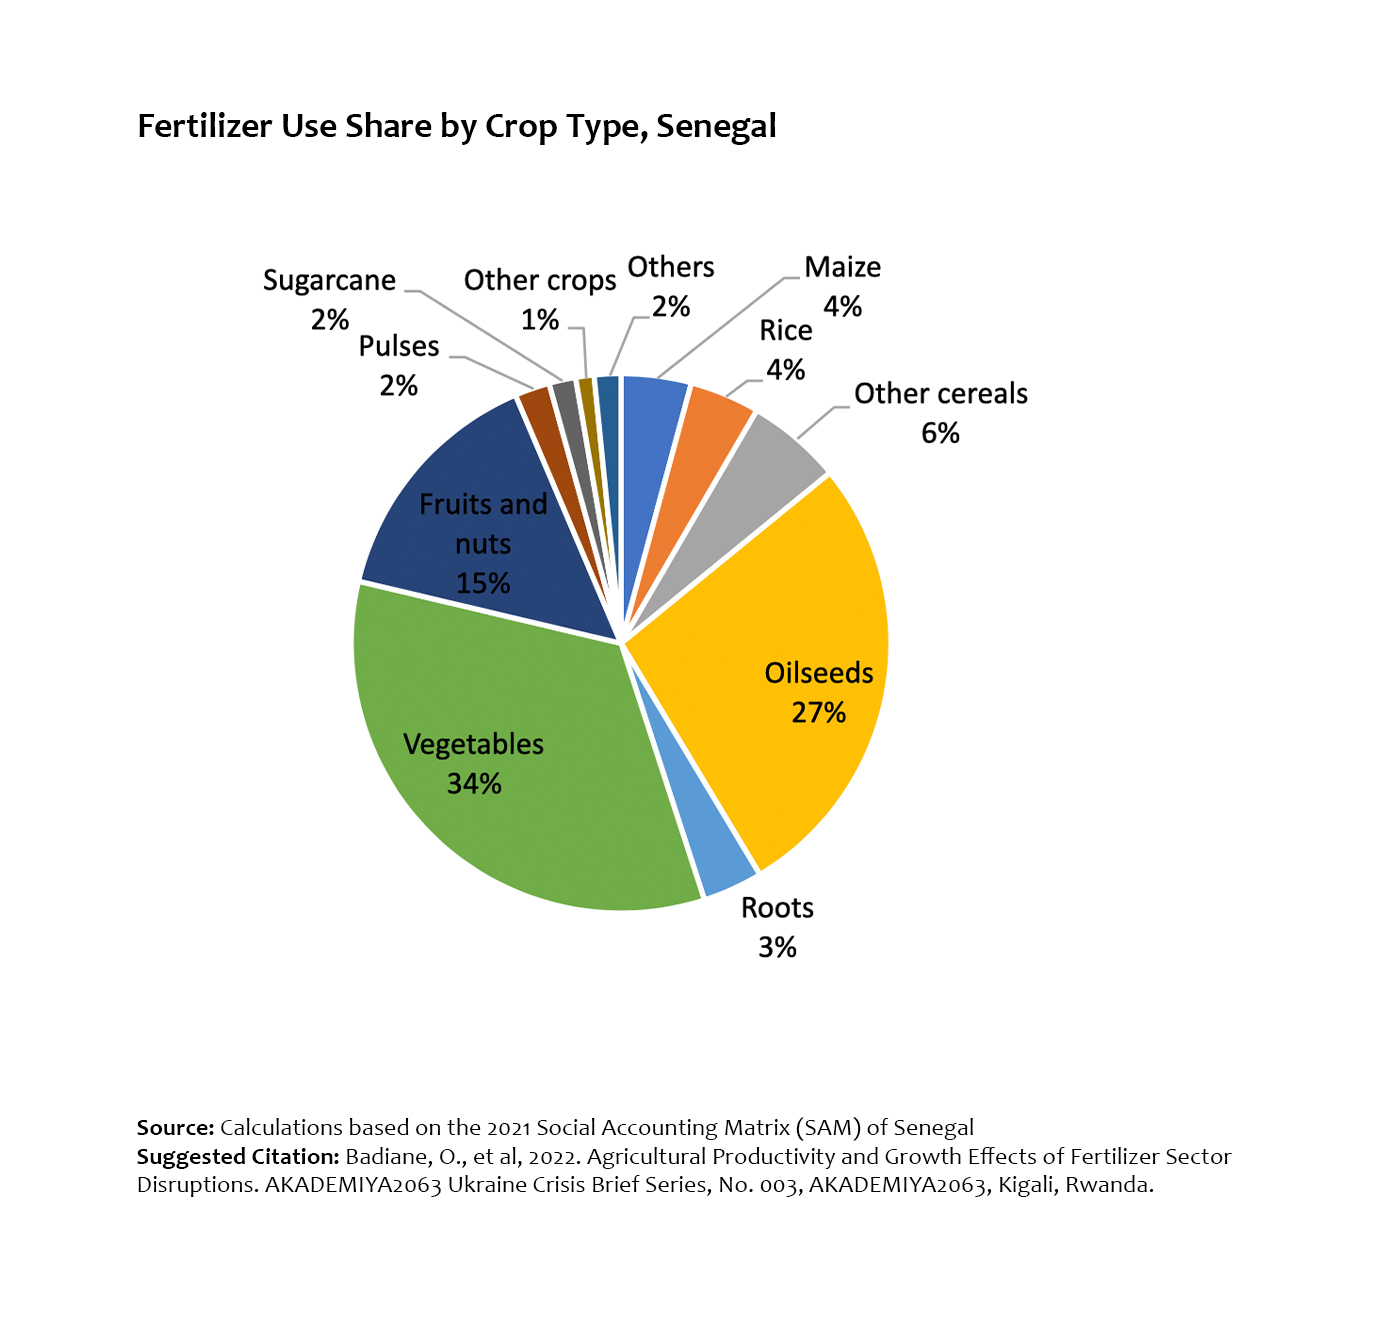
Fertilizer Use Share by Crop Type, Senegal
Fertilizer Use Share by Crop Type, Tanzania
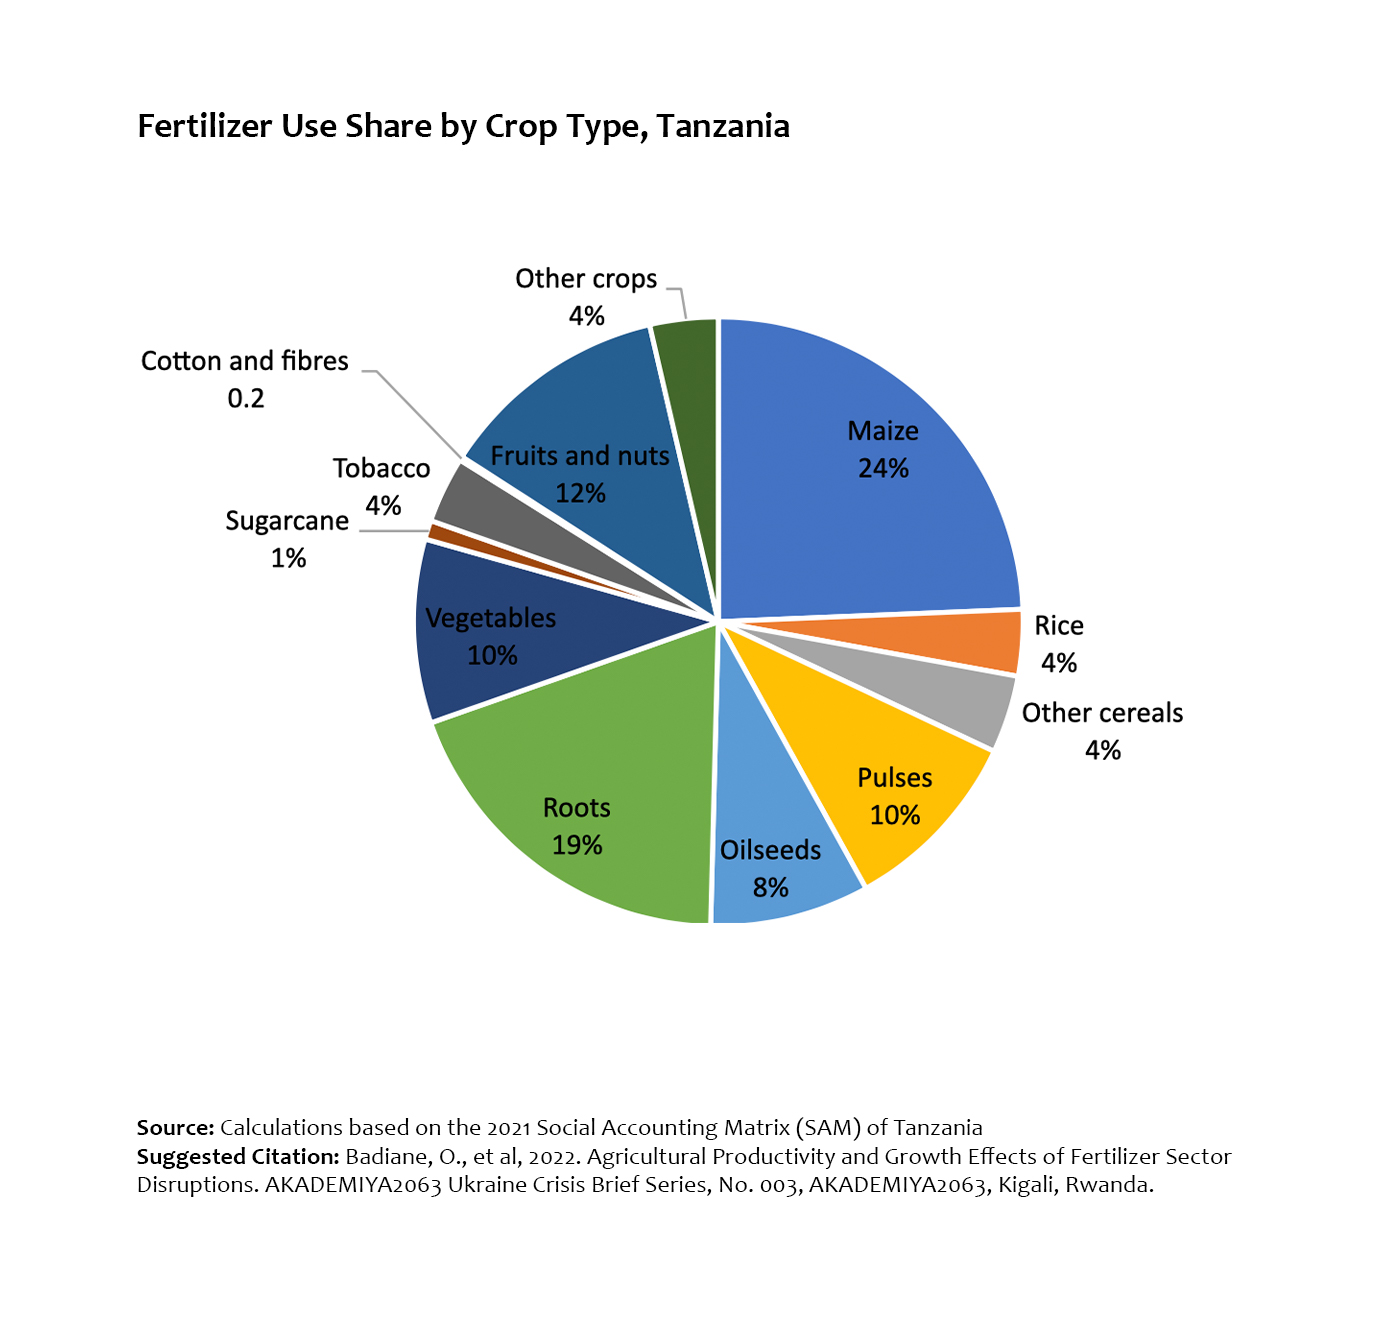
Fertilizer Use Share by Crop Type, Tanzania
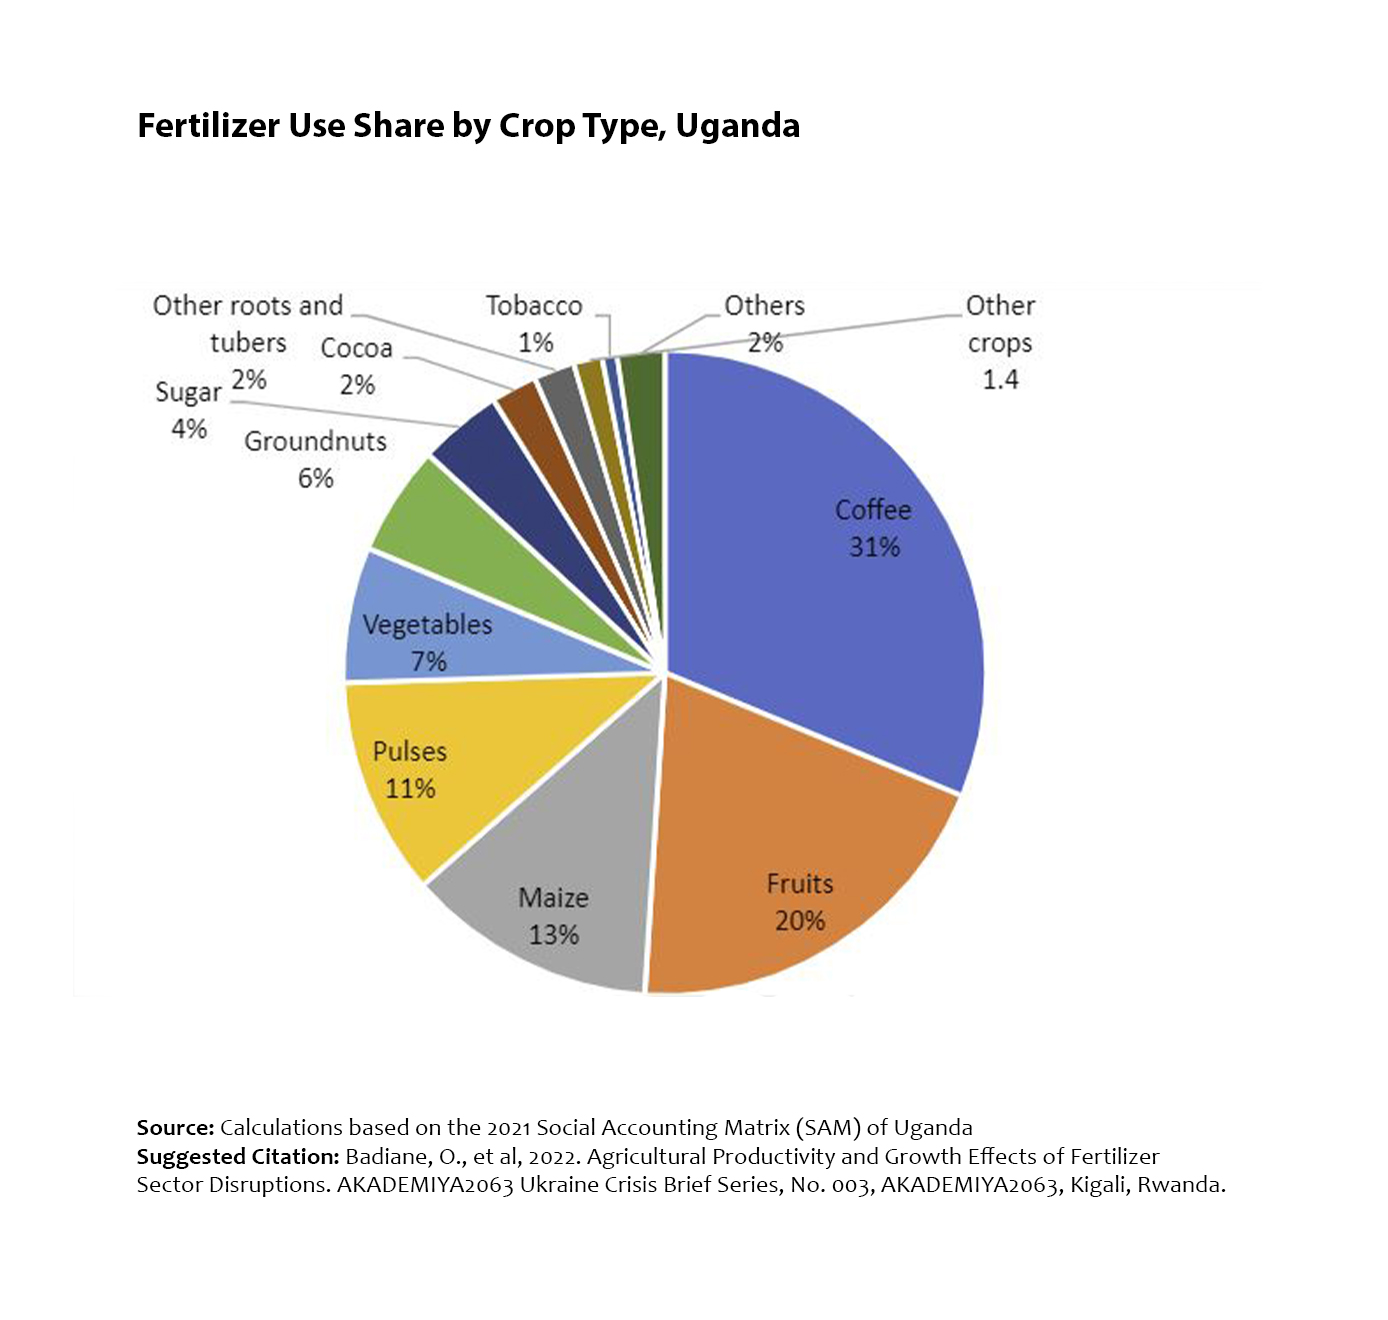
Fertilizer Use Share by Crop Type, Uganda
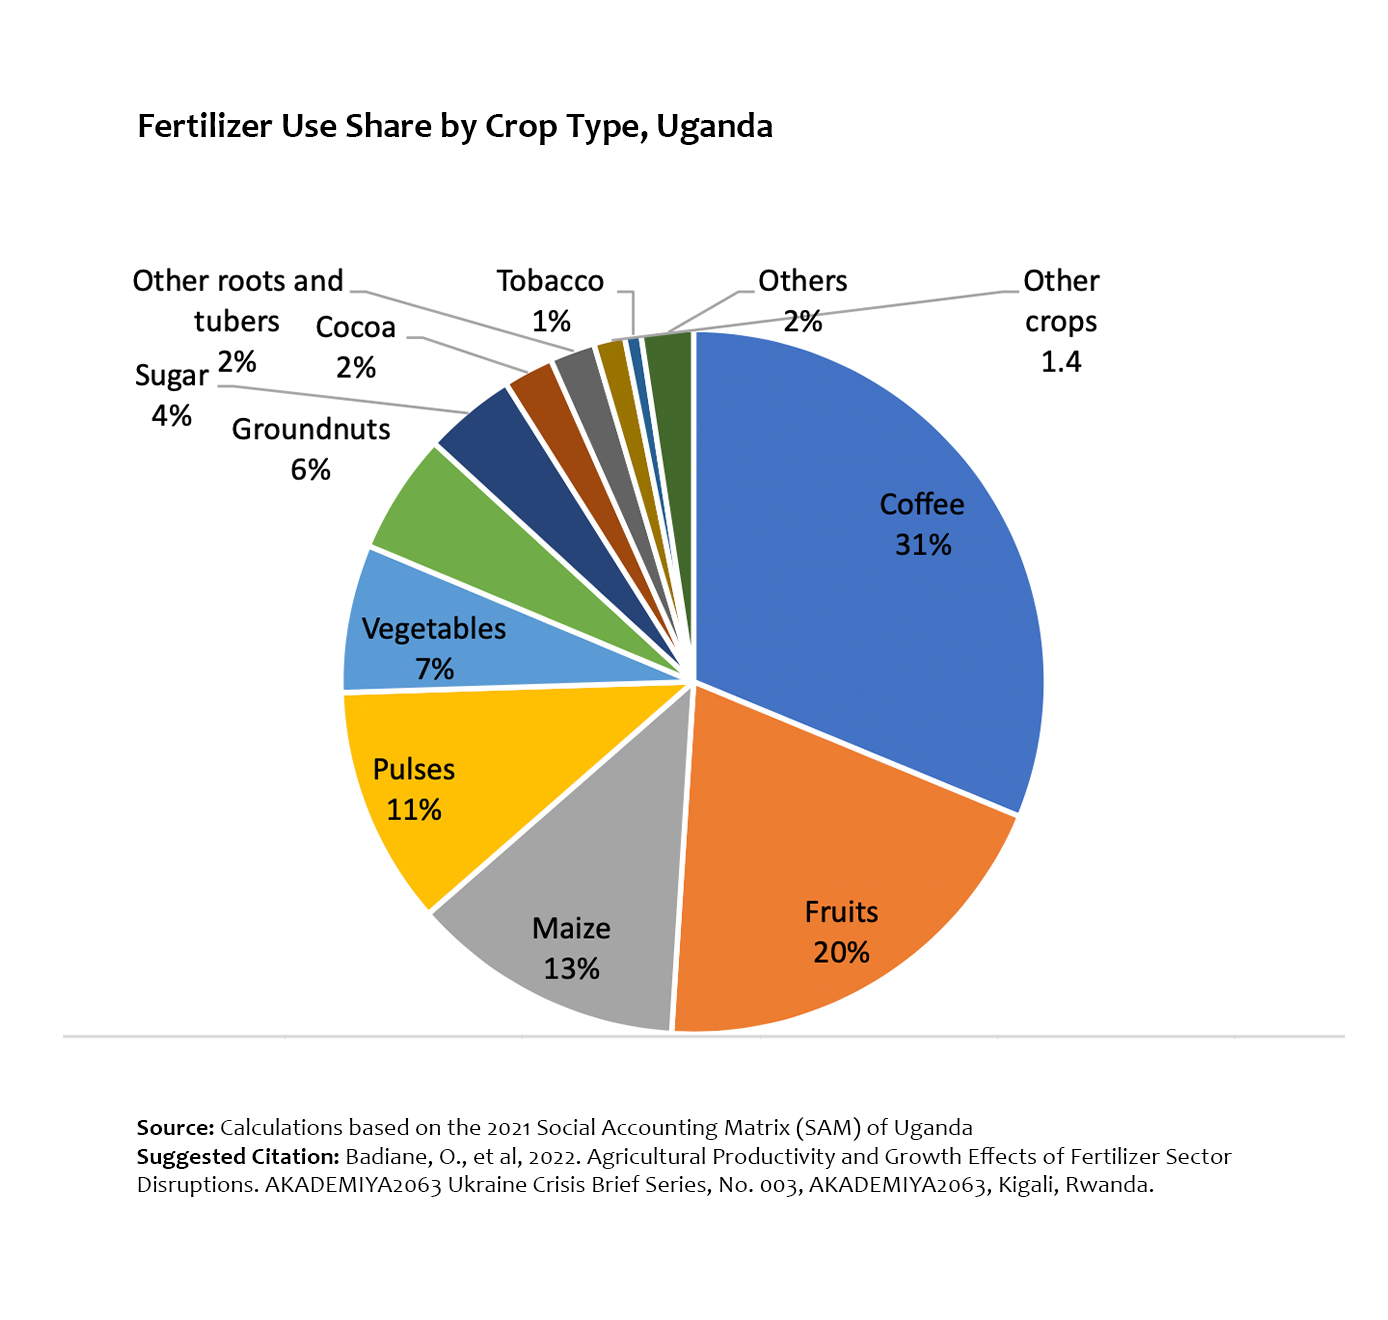
Fertilizer Use Share by Crop Type, Uganda
Fertilizer Use by Type of Crop in Ghana, Percentage Changes Ukraine Compared to Baseline
Scenarios
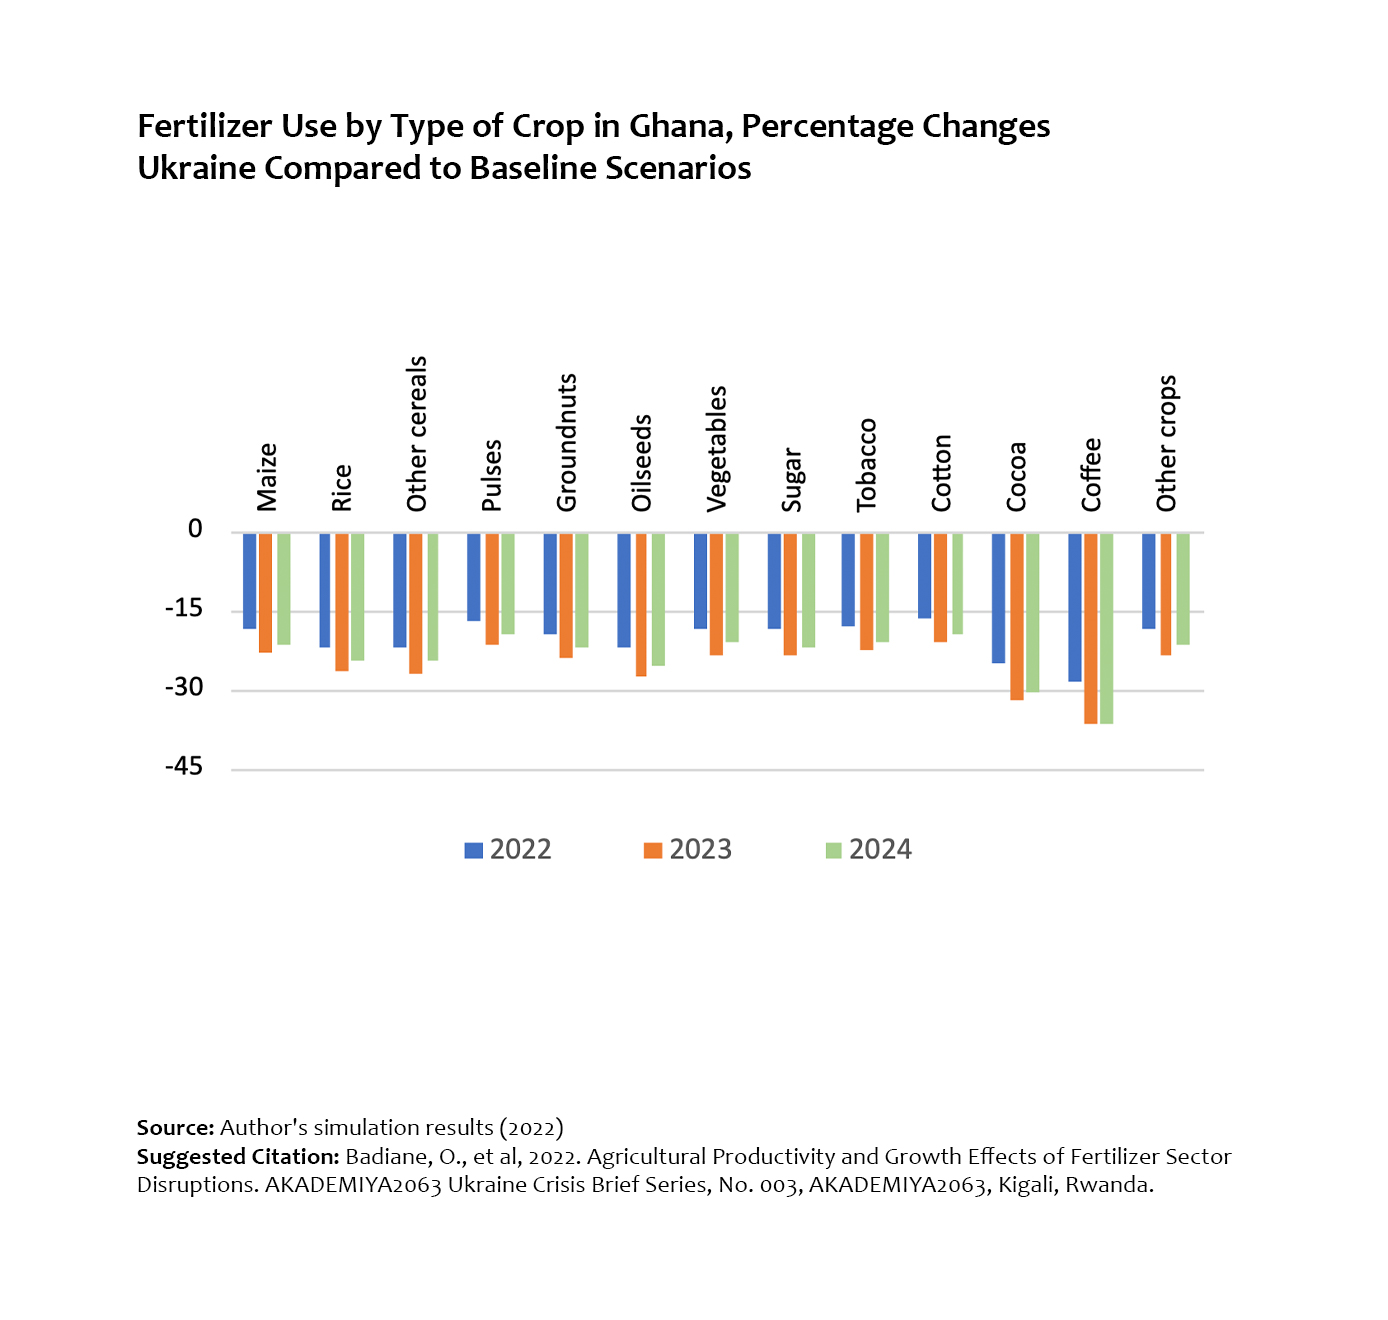
Fertilizer Use by Type of Crop in Ghana, Percentage Changes Ukraine Compared to Baseline Scenarios
Fertilizer Use by Type of Crop in Kenya, Percentage Changes Ukraine Compared to Baseline
Scenarios
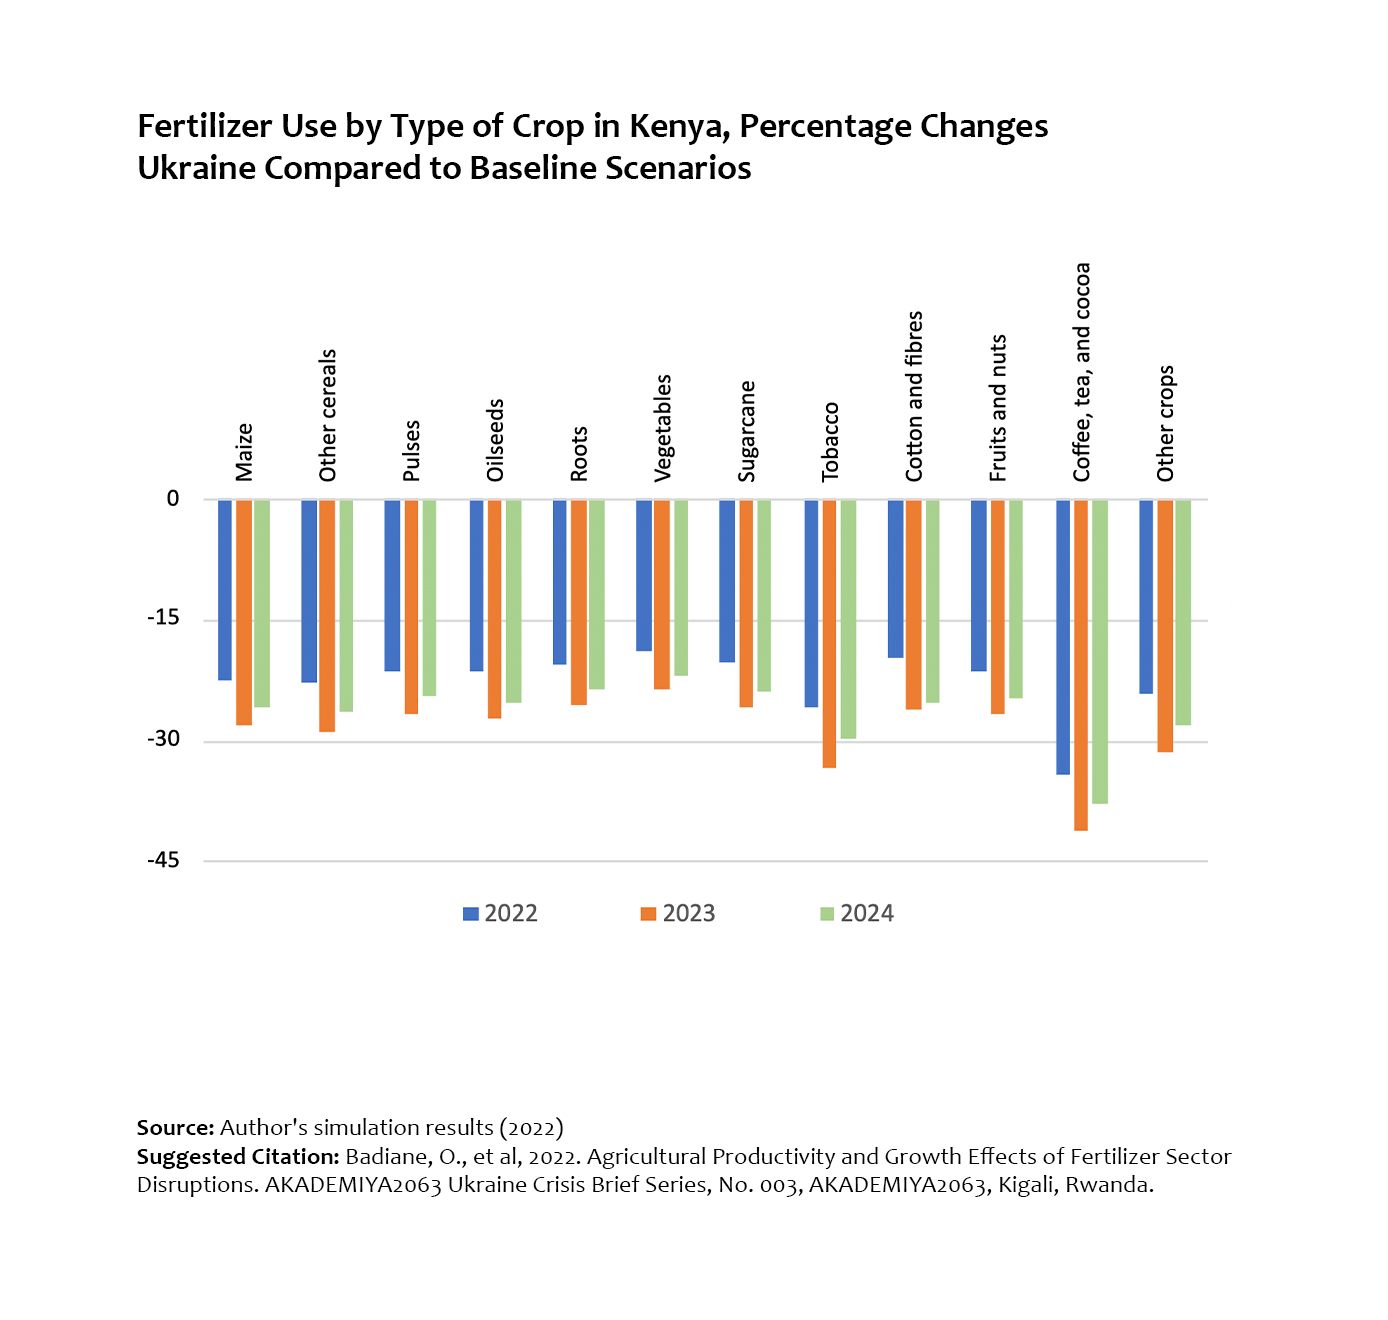
Fertilizer Use by Type of Crop in Kenya, Percentage Changes Ukraine Compared to Baseline Scenarios
Fertilizer Use by Type of Crop in Malawi, Percentage Changes Ukraine Compared to
Baseline Scenarios
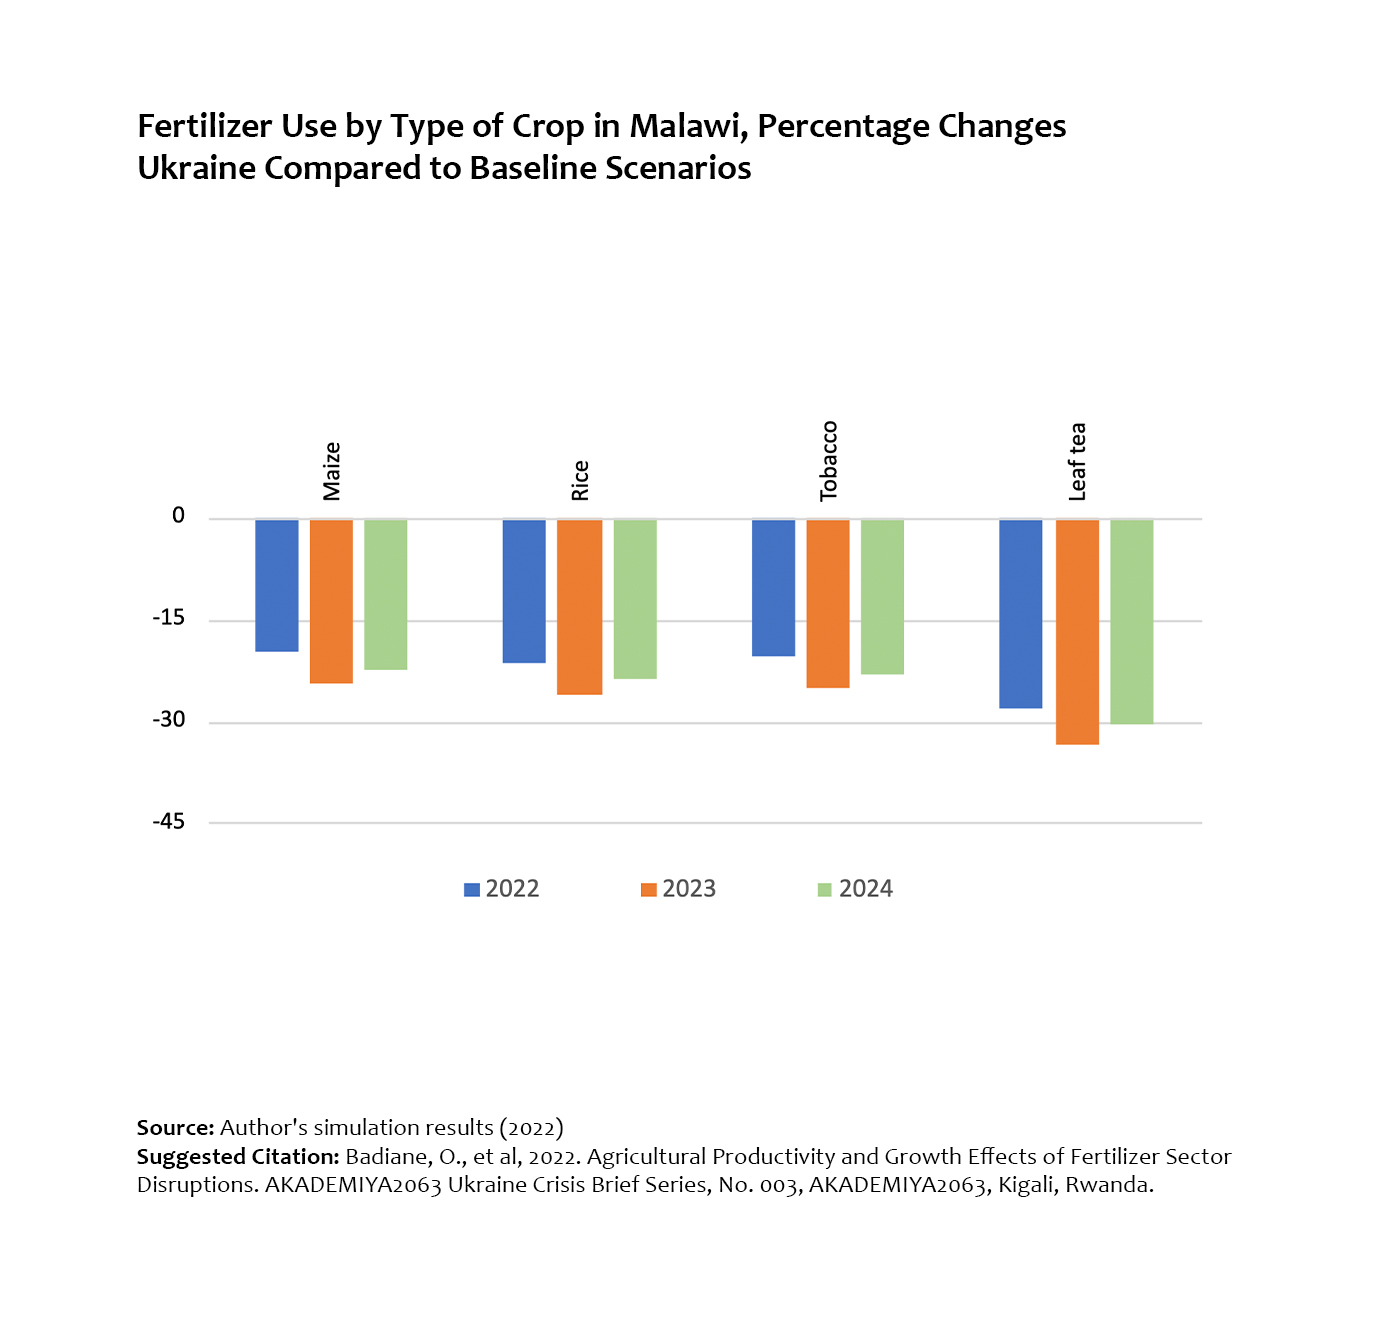
Fertilizer Use by Type of Crop in Malawi, Percentage Changes Ukraine Compared to Baseline Scenarios
Fertilizer Use by Type of Crop in Mozambique, Percentage Changes Ukraine Compared to
Baseline Scenarios
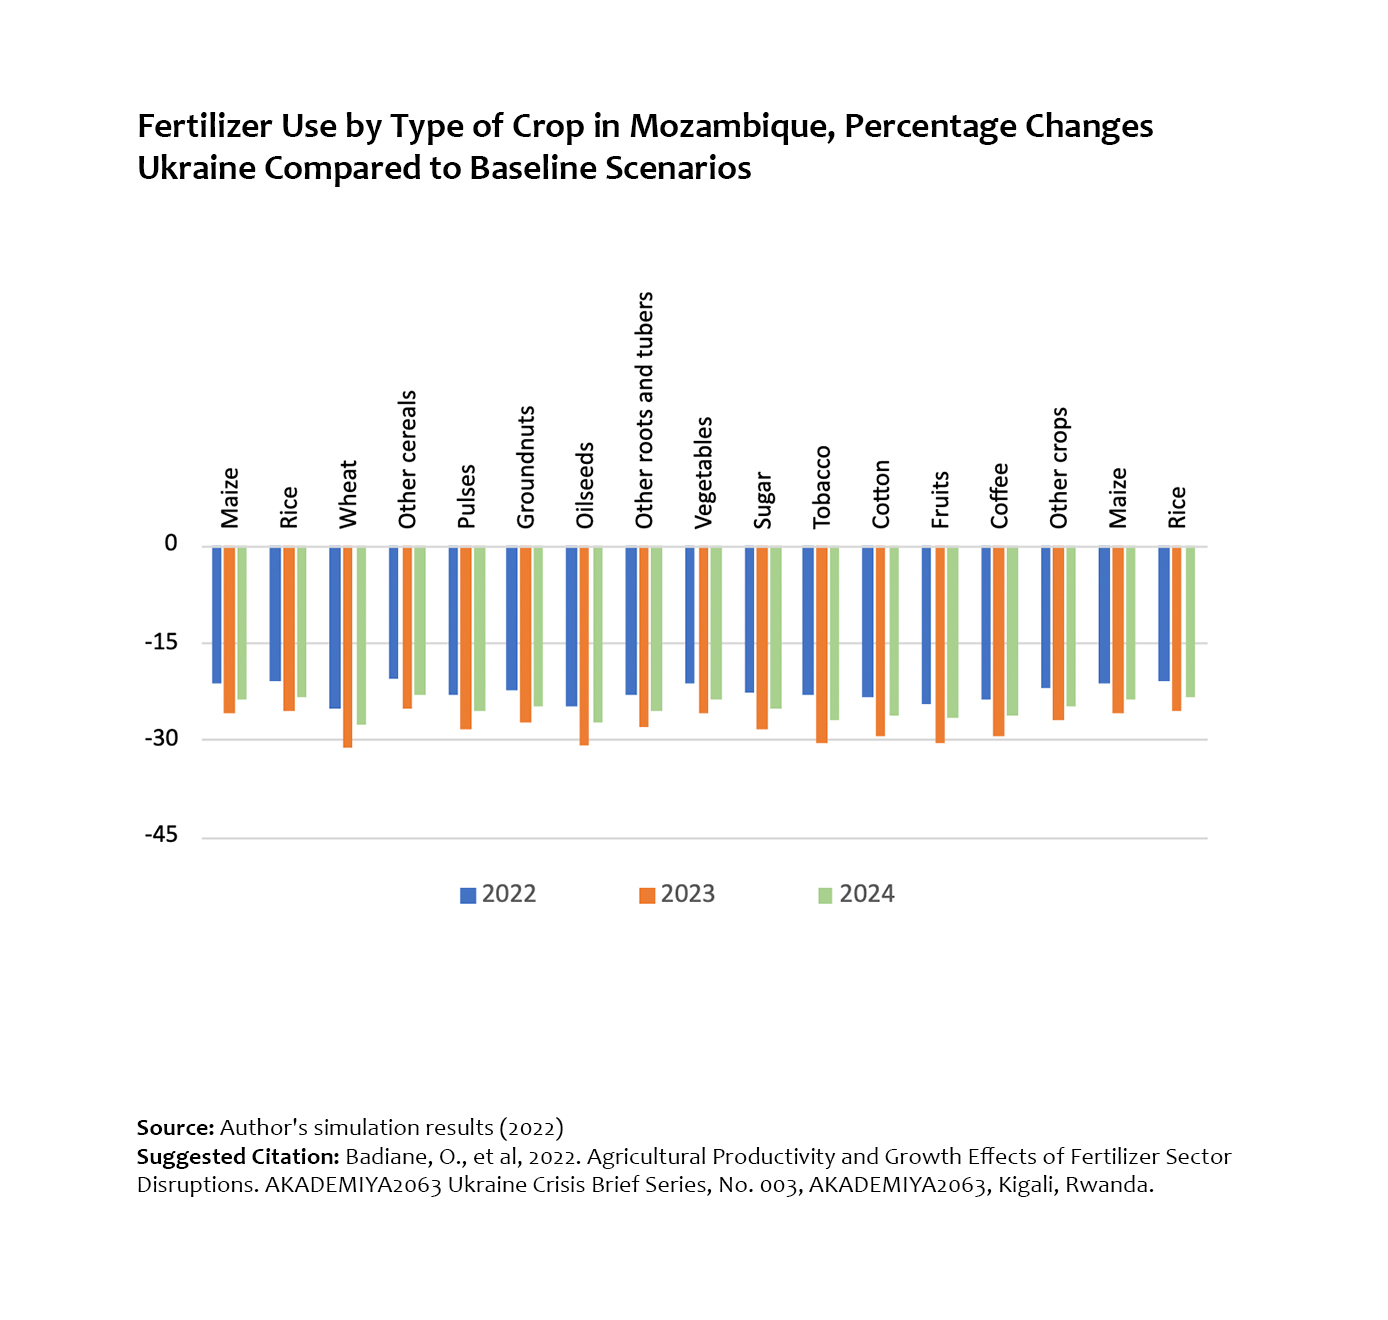
Fertilizer Use by Type of Crop in Mozambique, Percentage Changes Ukraine Compared to Baseline Scenarios
Fertilizer Use by Type of Crop in Nigeria, Percentage Changes Ukraine Compared to
Baseline Scenarios
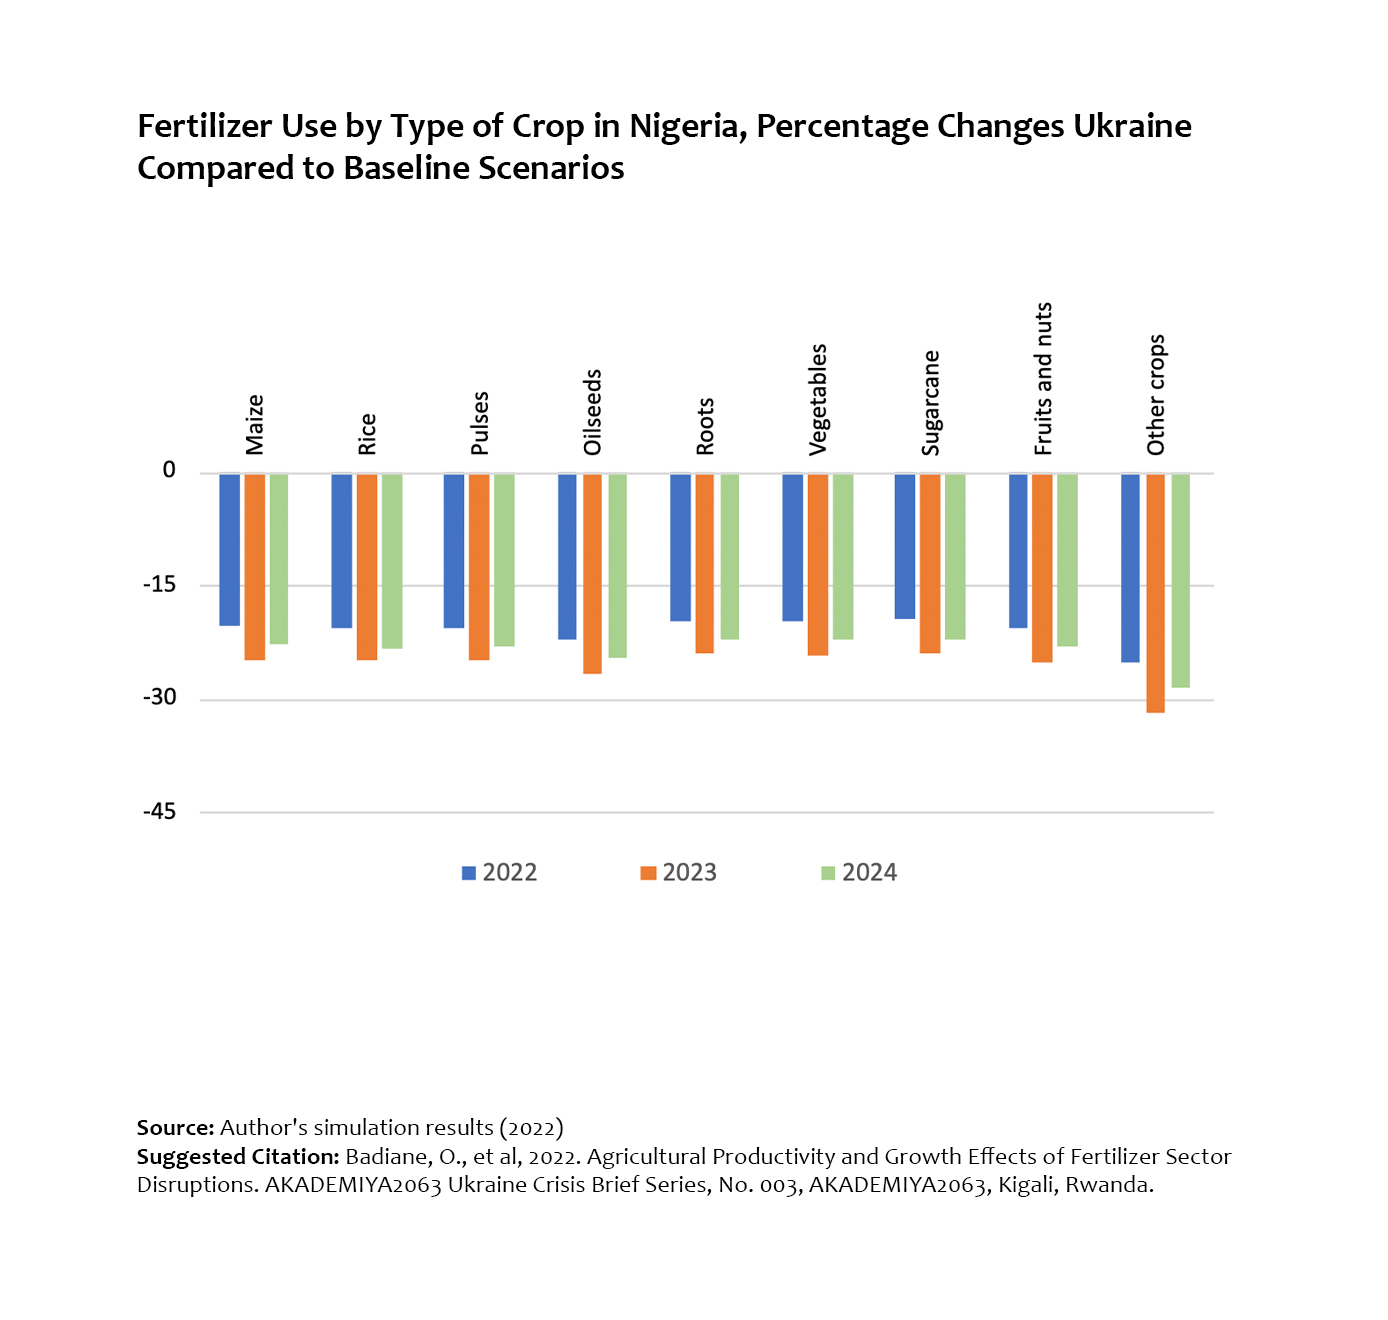
Fertilizer Use by Type of Crop in Nigeria, Percentage Changes Ukraine Compared to Baseline Scenarios
Fertilizer Use by Type of Crop in Senegal, Percentage Changes Ukraine Compared to
Baseline Scenarios
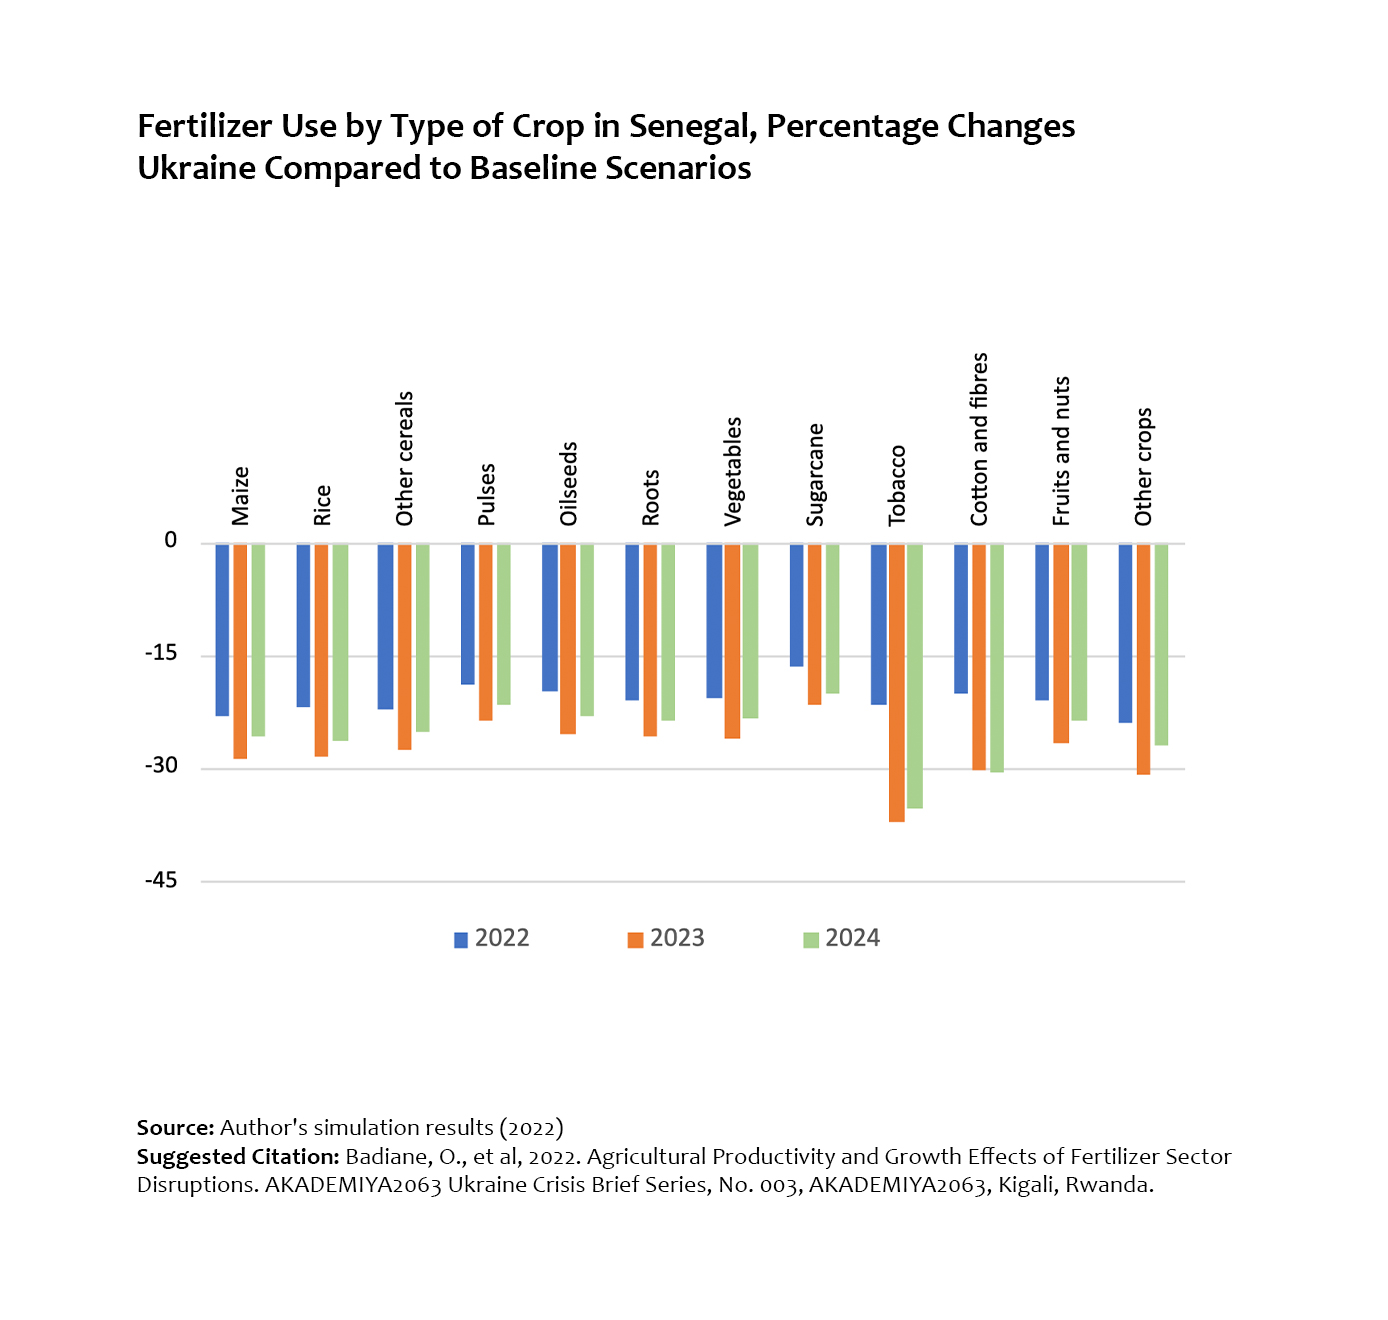
Fertilizer Use by Type of Crop in Senegal, Percentage Changes Ukraine Compared to Baseline Scenarios
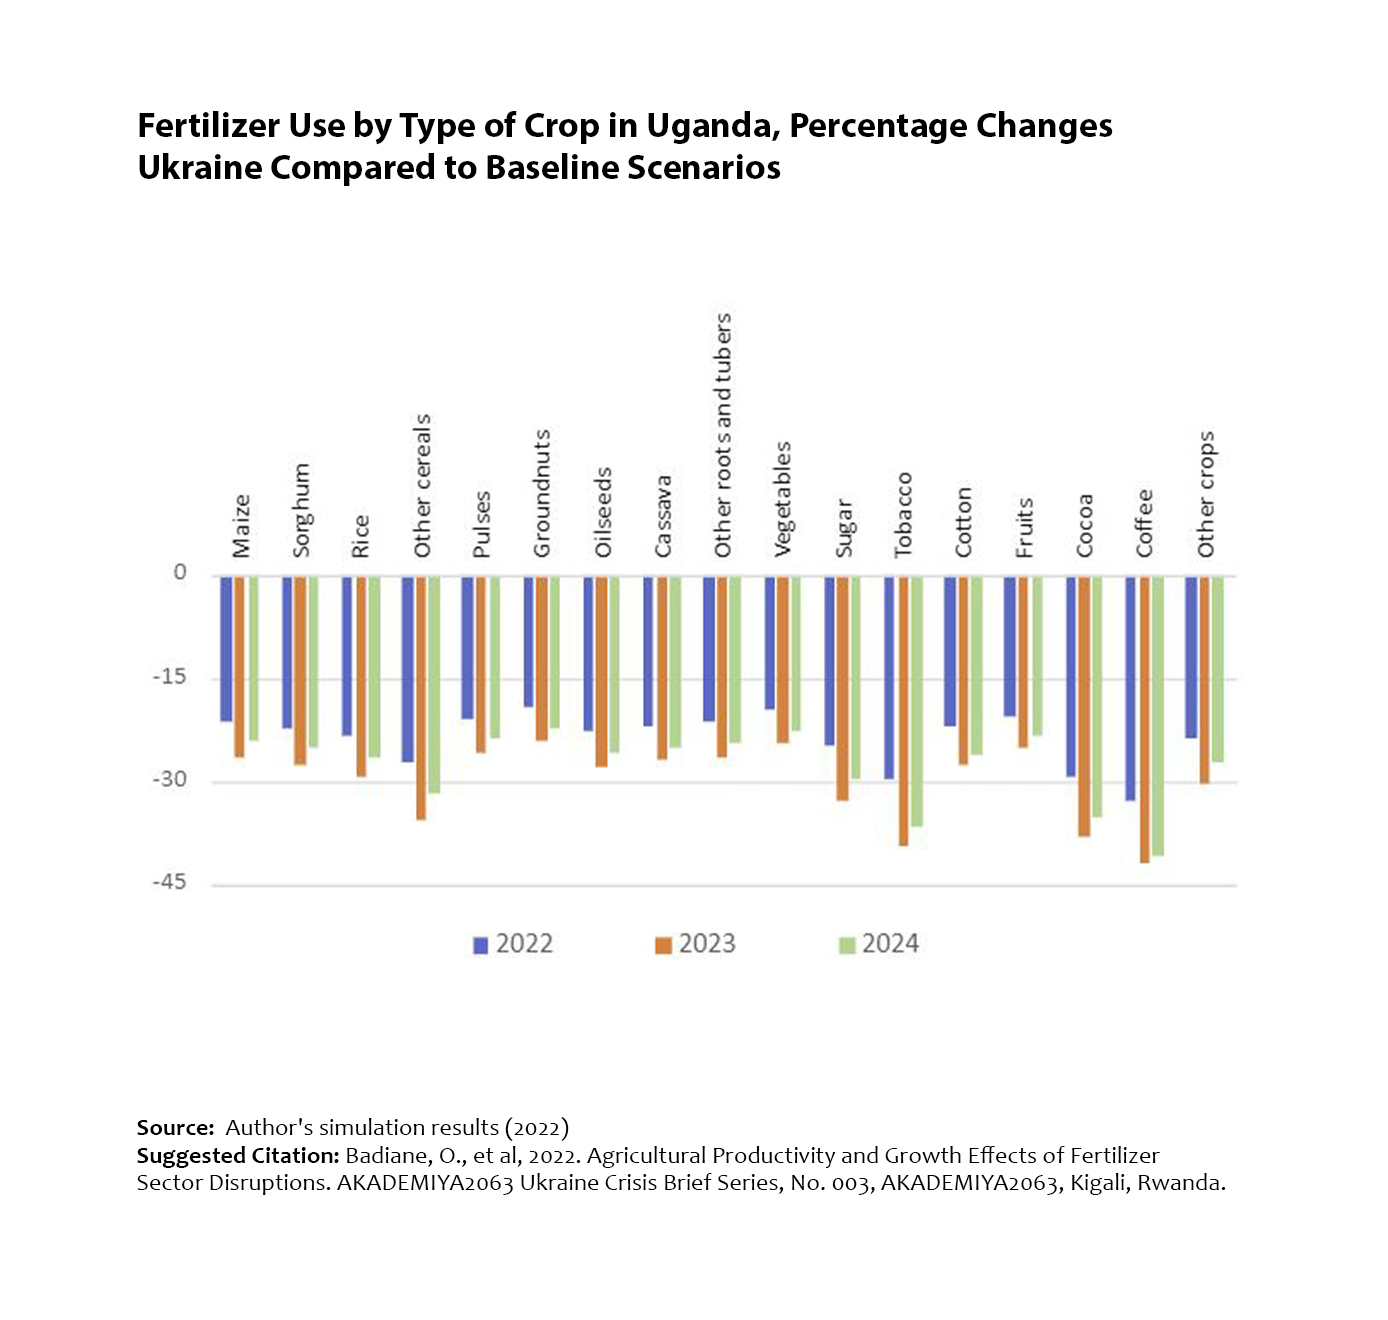
Fertilizer Use by Type of Crop in Uganda, Percentage Changes Ukraine Compared to
Baseline Scenarios
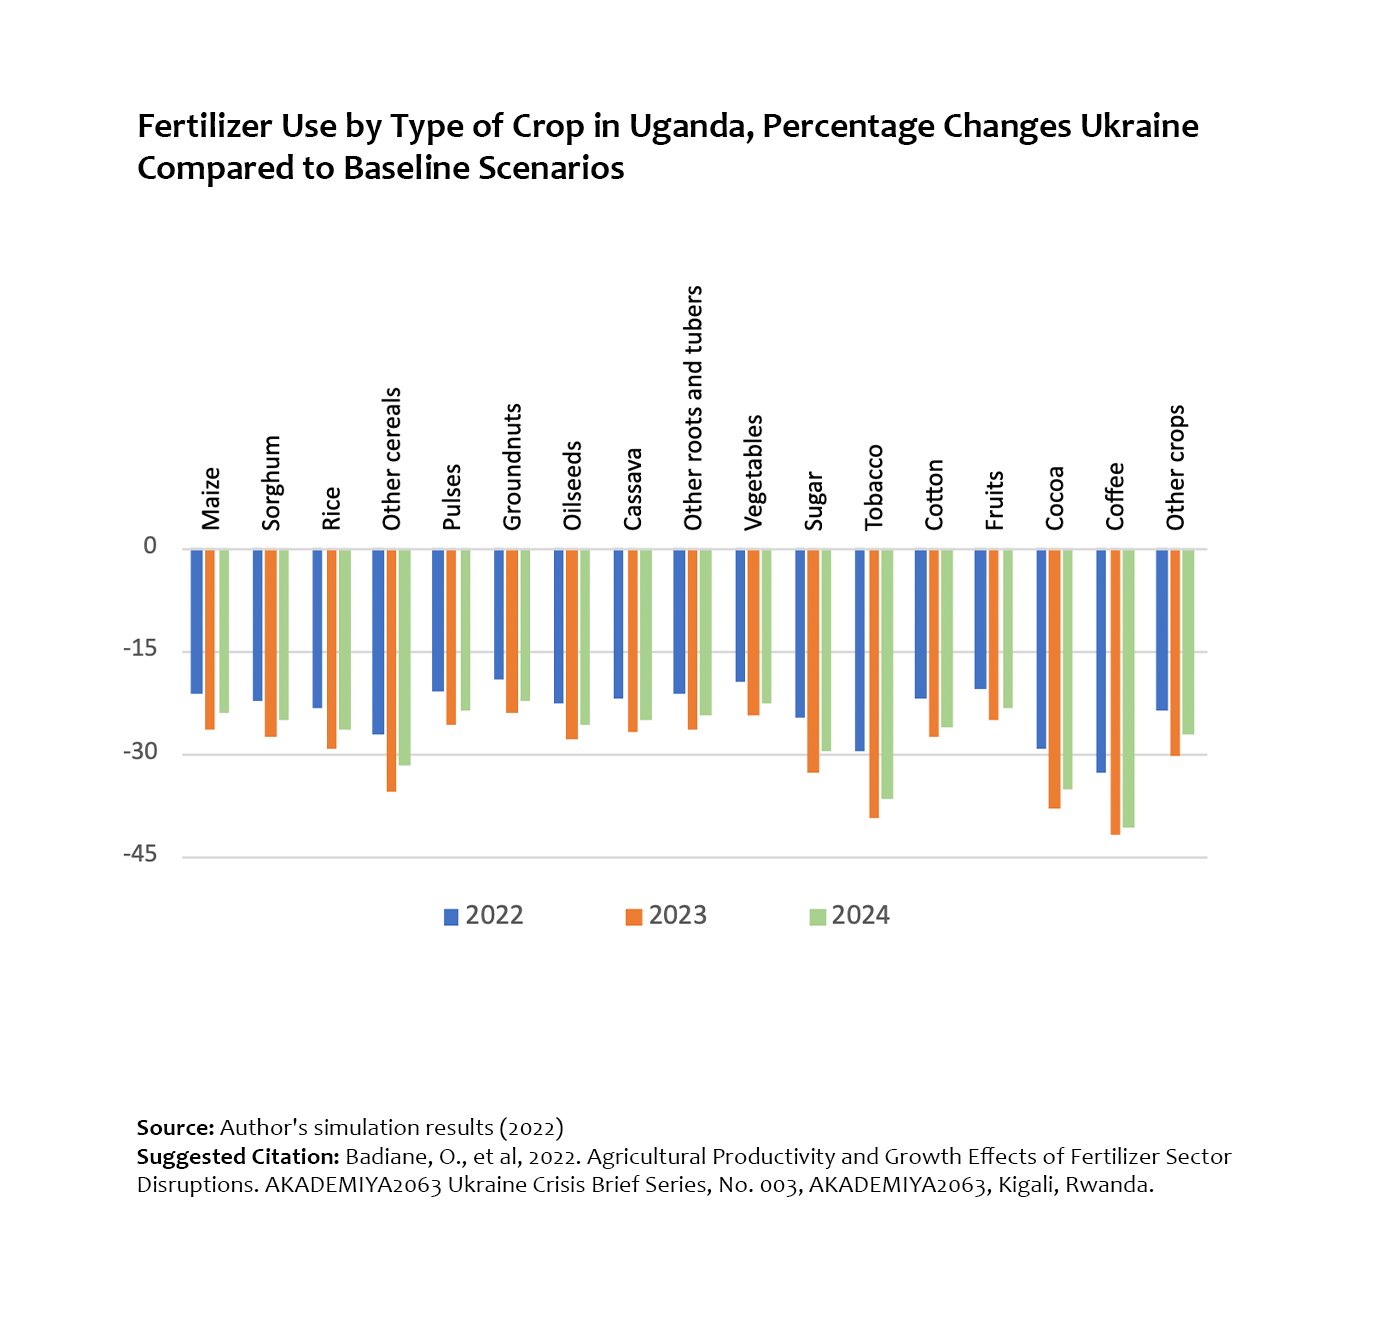
Fertilizer Use by Type of Crop in Uganda, Percentage Changes Ukraine Compared to Baseline Scenarios
Output Effects in Ghana, Percentage Changes Ukraine Compared to Baseline Scenarios
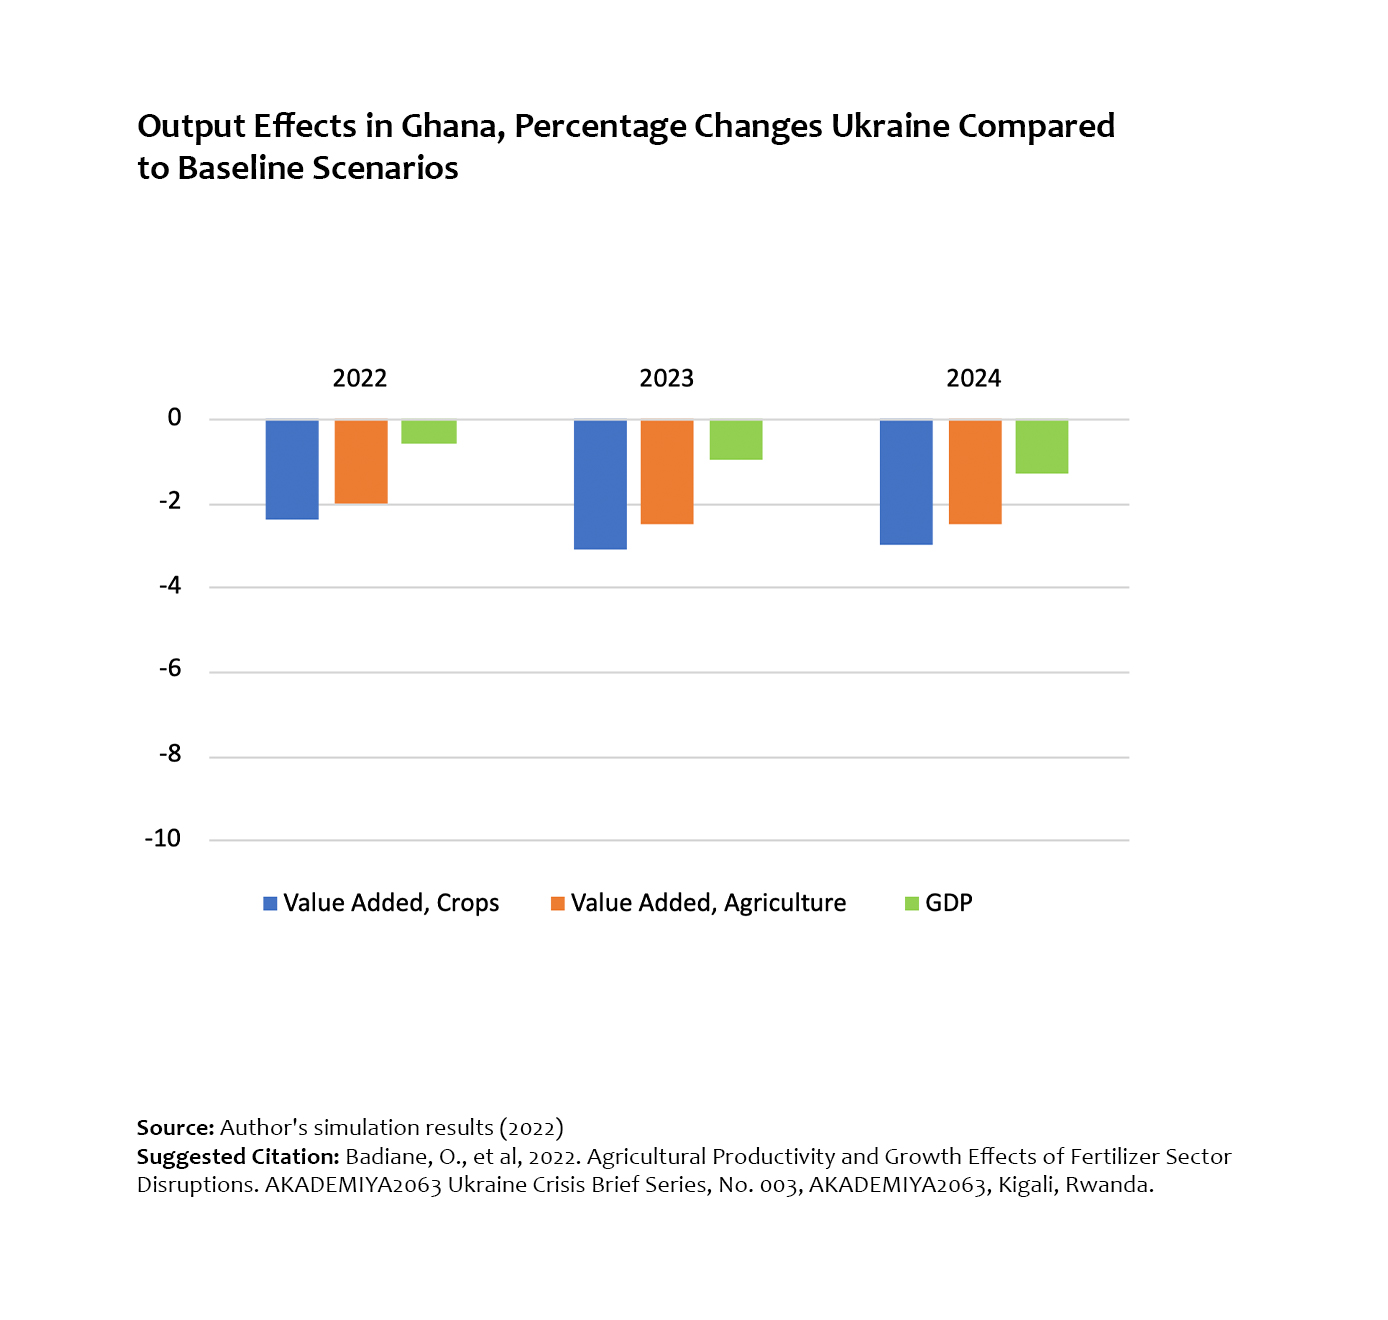
Output Effects in Ghana, Percentage Changes Ukraine Compared to Baseline Scenarios
Output Effects in Kenya, Percentage Changes Ukraine Compared to Baseline Scenarios
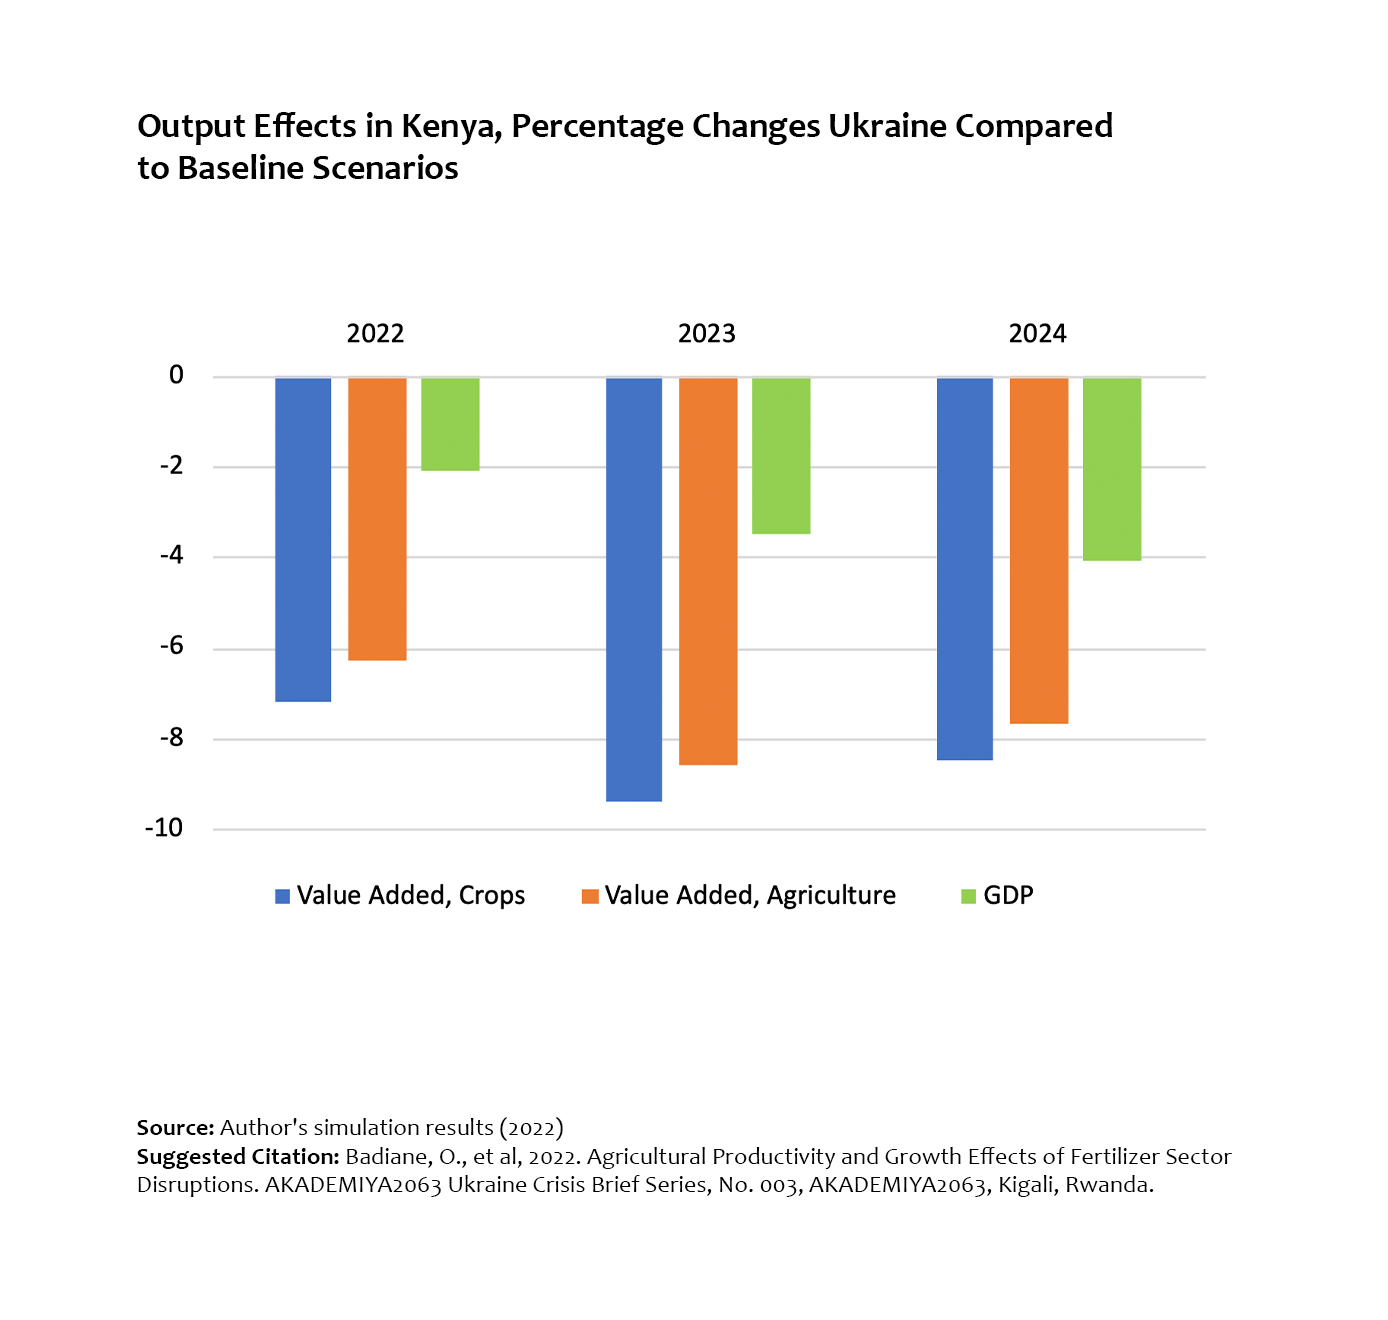
Output Effects in Kenya, Percentage Changes Ukraine Compared to Baseline Scenarios
Output Effects in Malawi, Percentage Changes Ukraine Compared to Baseline Scenarios
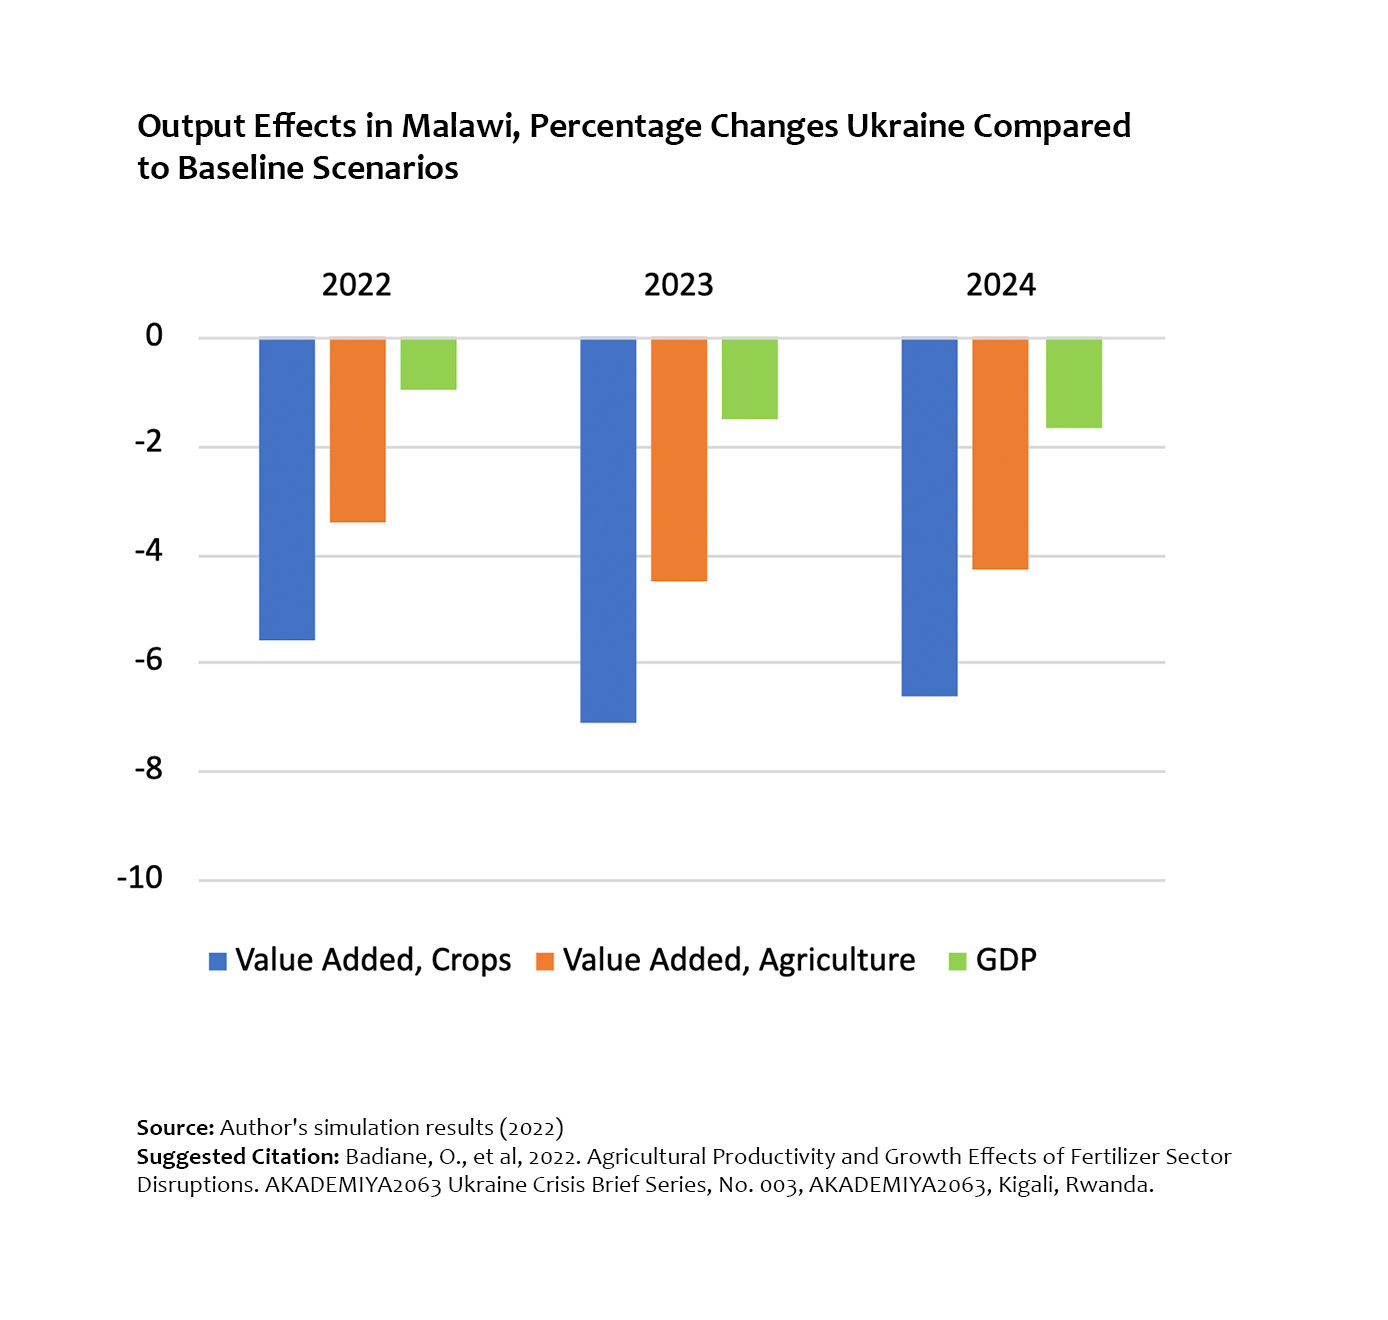
Output Effects in Malawi, Percentage Changes Ukraine Compared to Baseline Scenarios
Output Effects in Mozambique, Percentage Changes Ukraine Compared to Baseline Scenarios
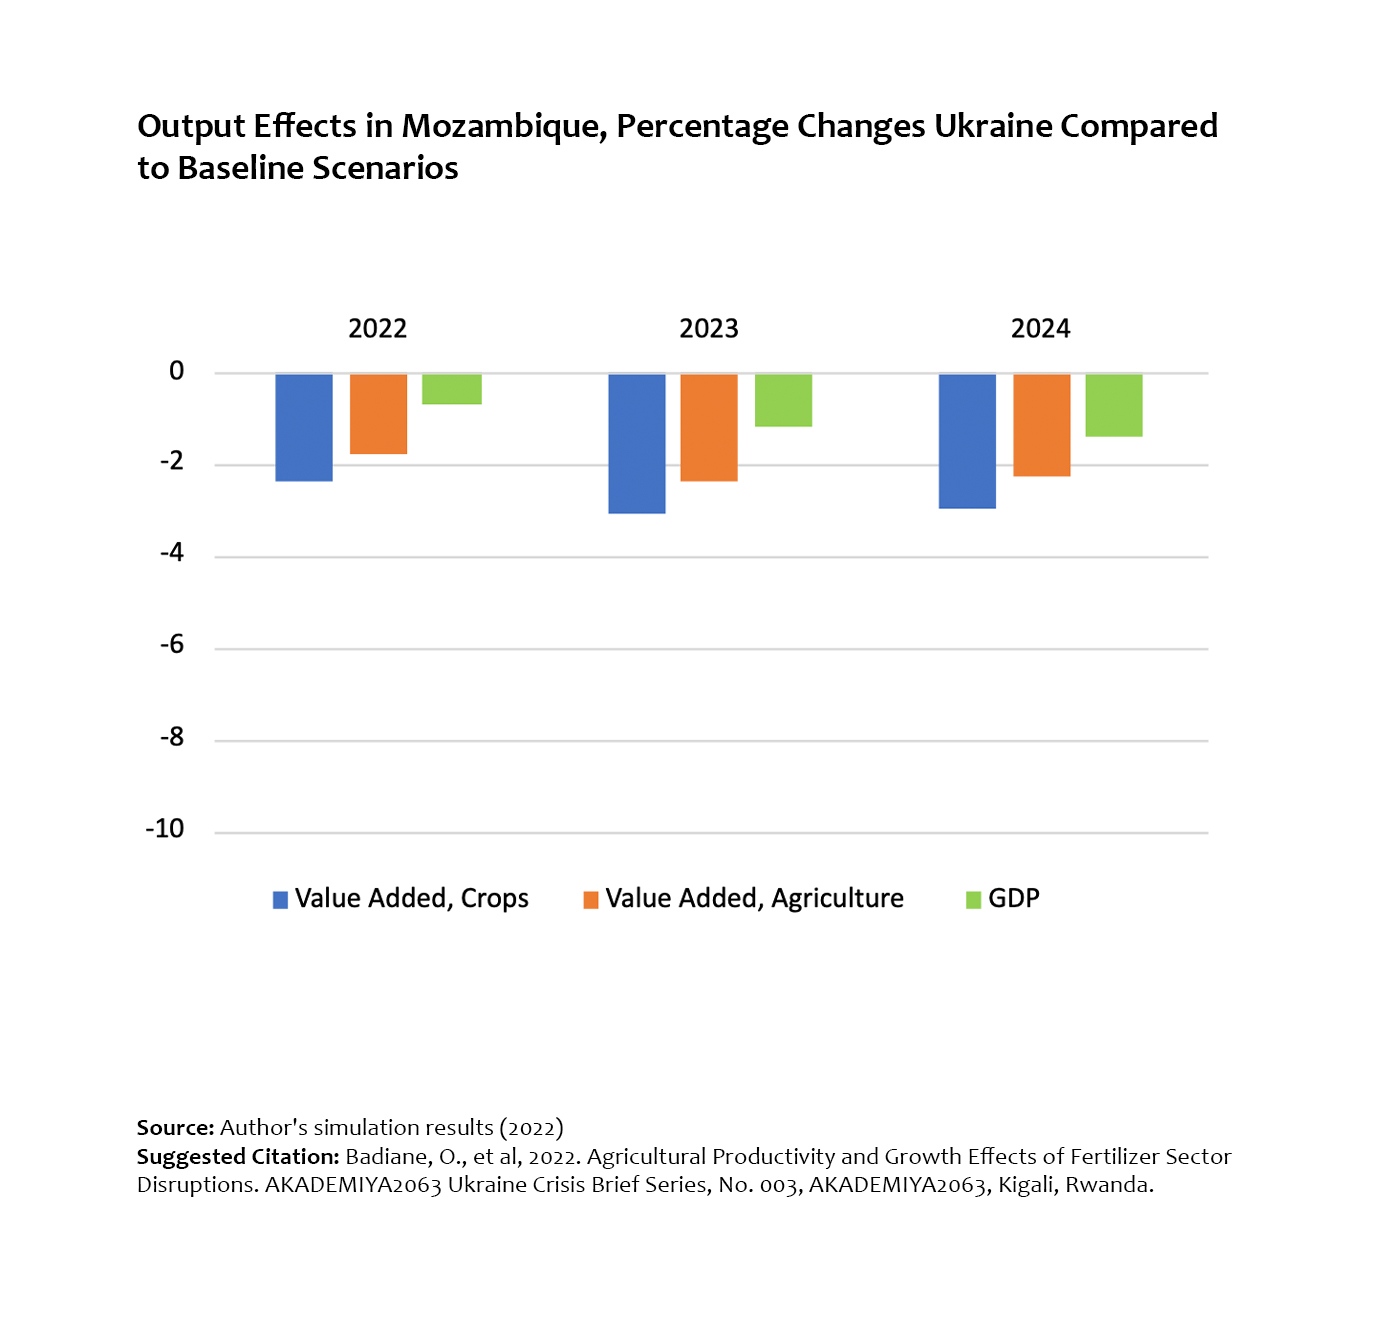
Output Effects in Mozambique, Percentage Changes Ukraine Compared to Baseline Scenarios
Output Effects in Nigeria, Percentage Changes Ukraine Compared to Baseline Scenarios
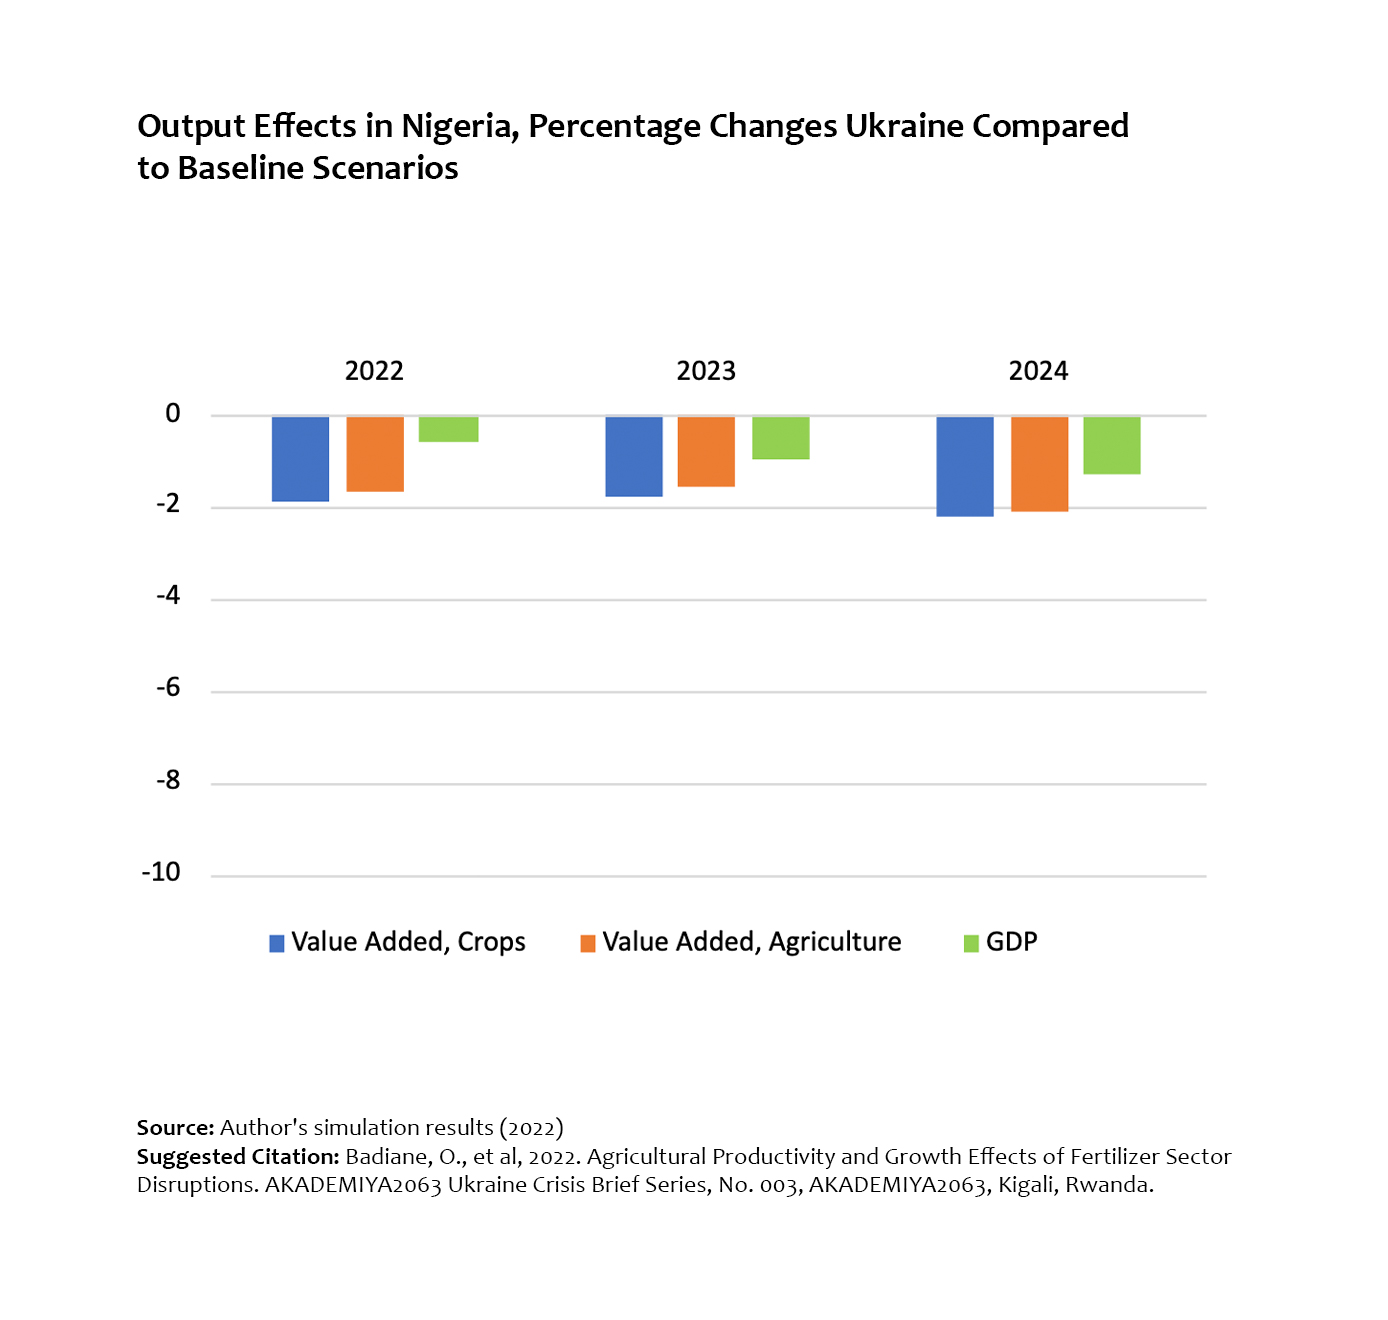
Output Effects in Nigeria, Percentage Changes Ukraine Compared to Baseline Scenarios
Output Effects in Senegal, Percentage Changes Ukraine Compared to Baseline Scenarios
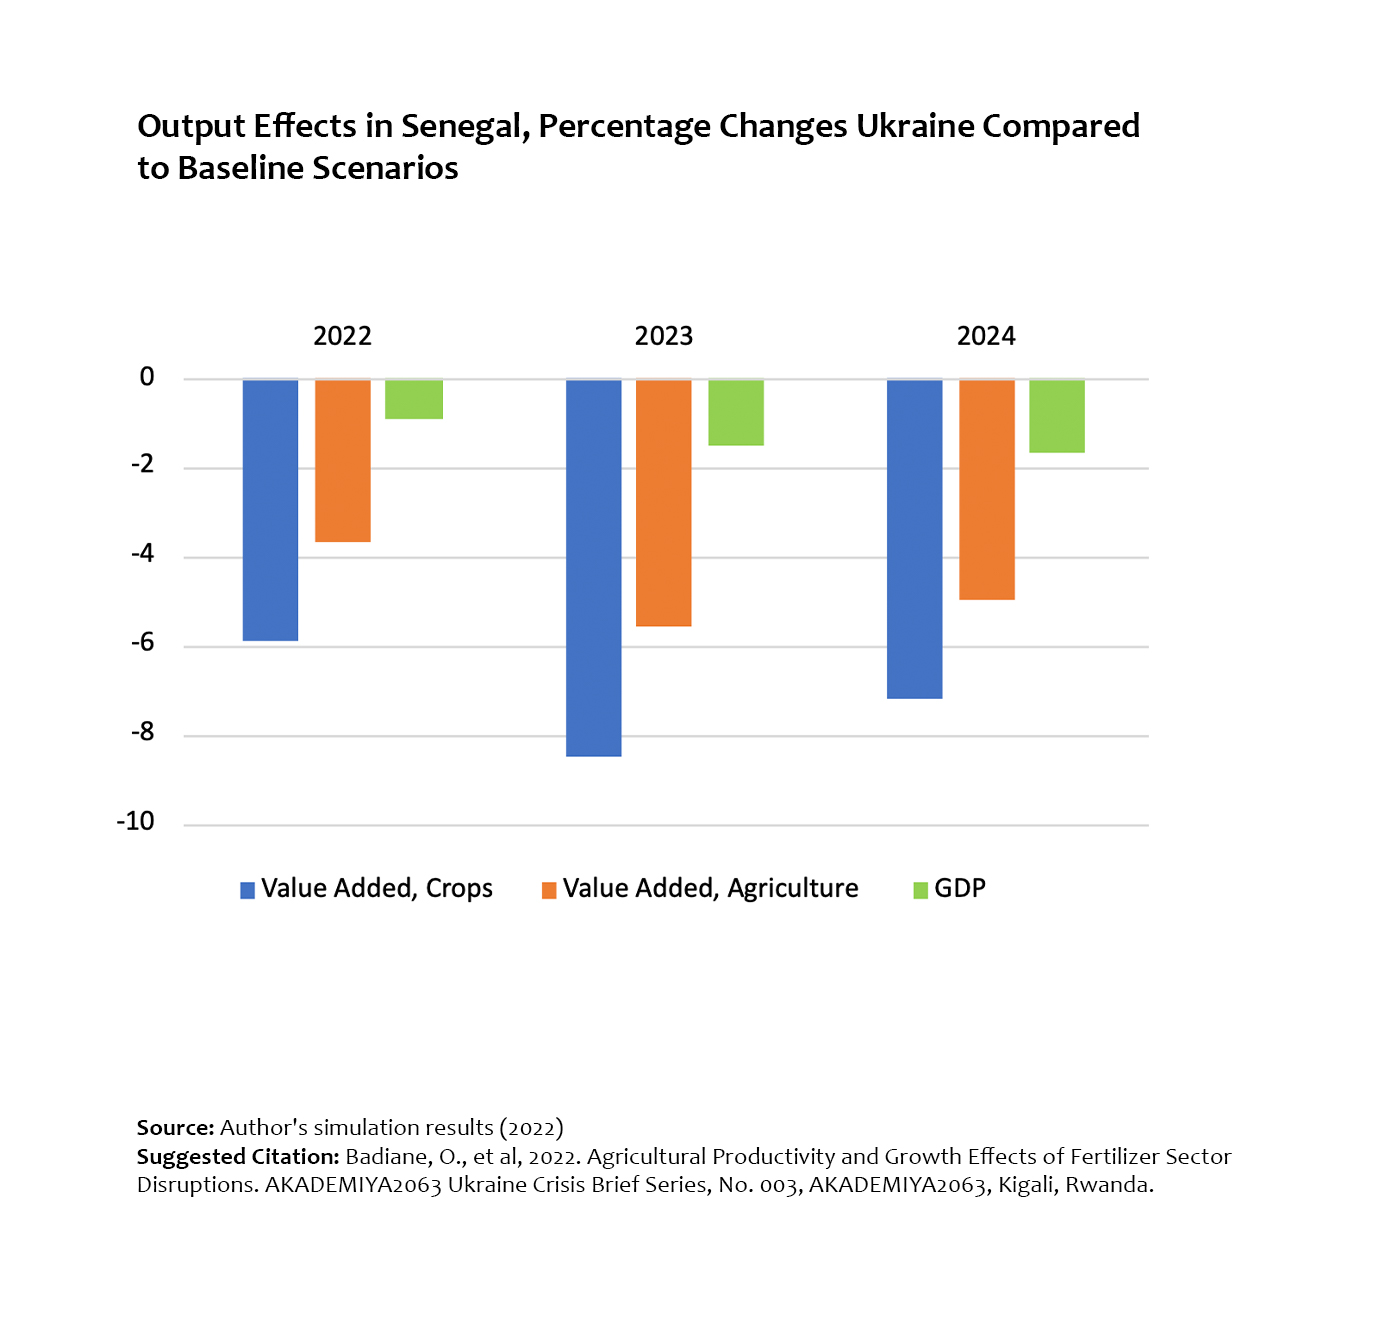
Output Effects in Senegal, Percentage Changes Ukraine Compared to Baseline Scenarios
Output Effects in Tanzania, Percentage Changes Ukraine Compared to Baseline Scenarios
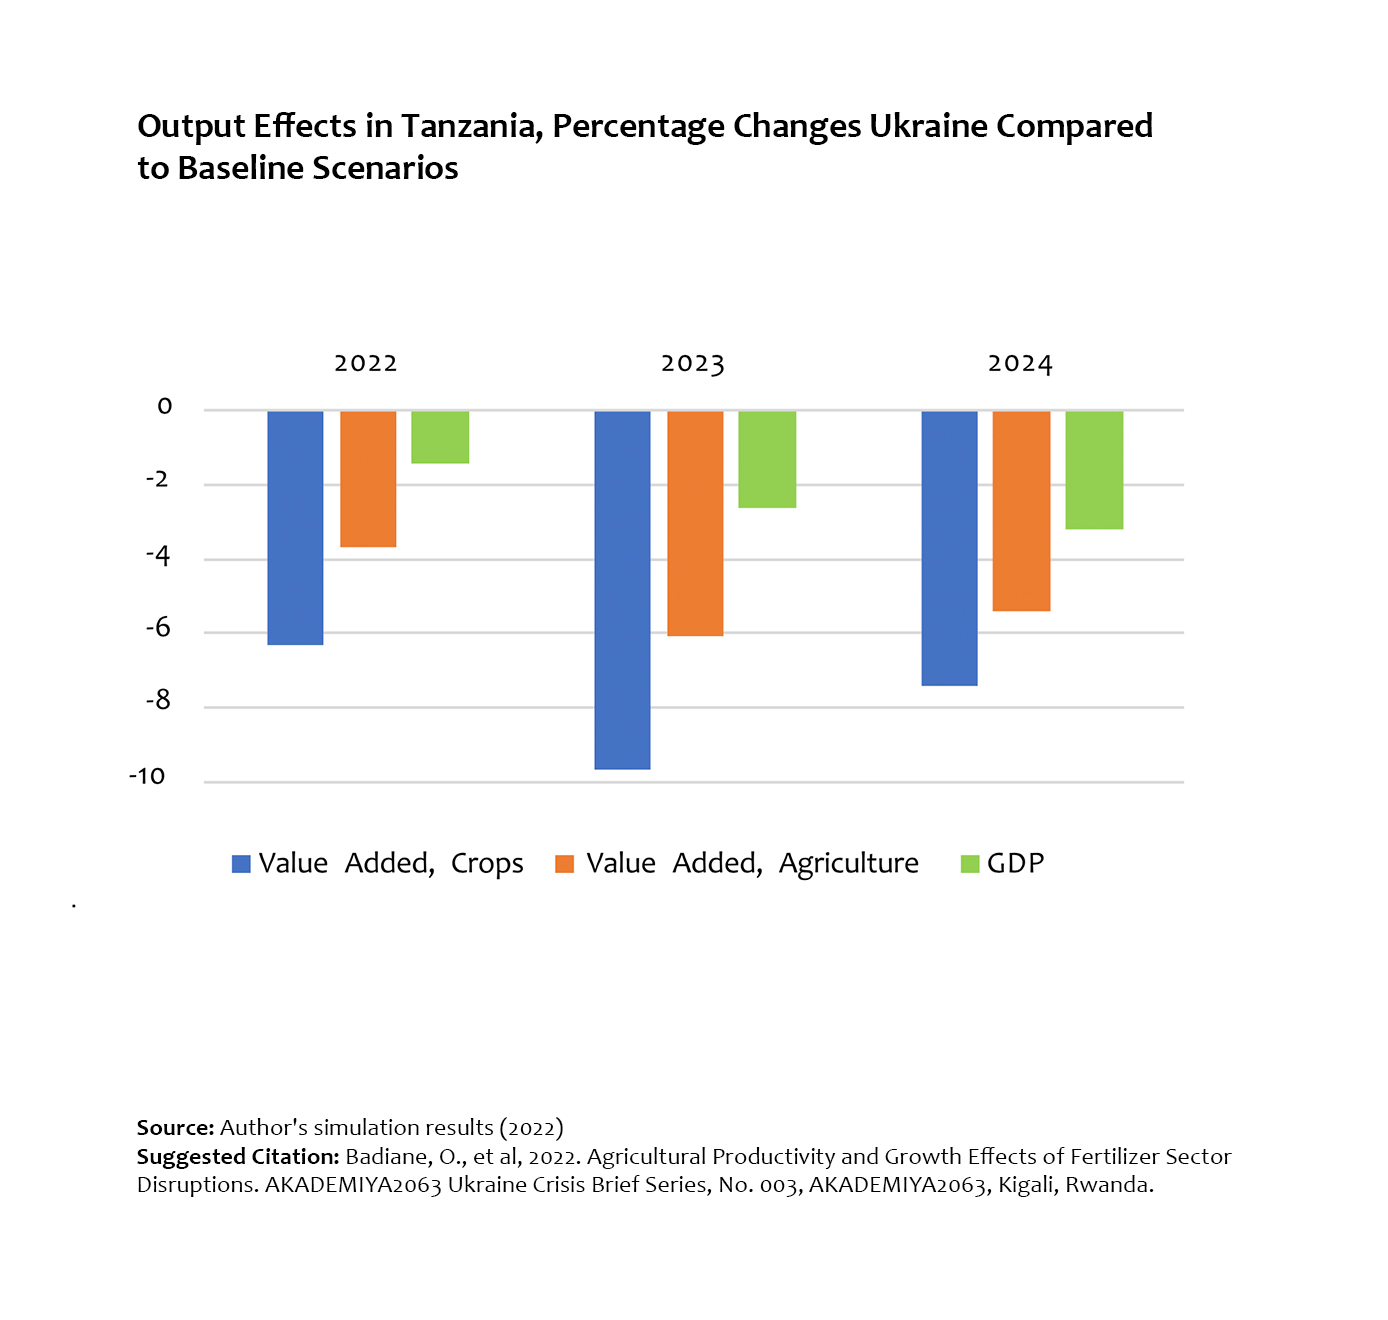
Output Effects in Tanzania, Percentage Changes Ukraine Compared to Baseline Scenarios
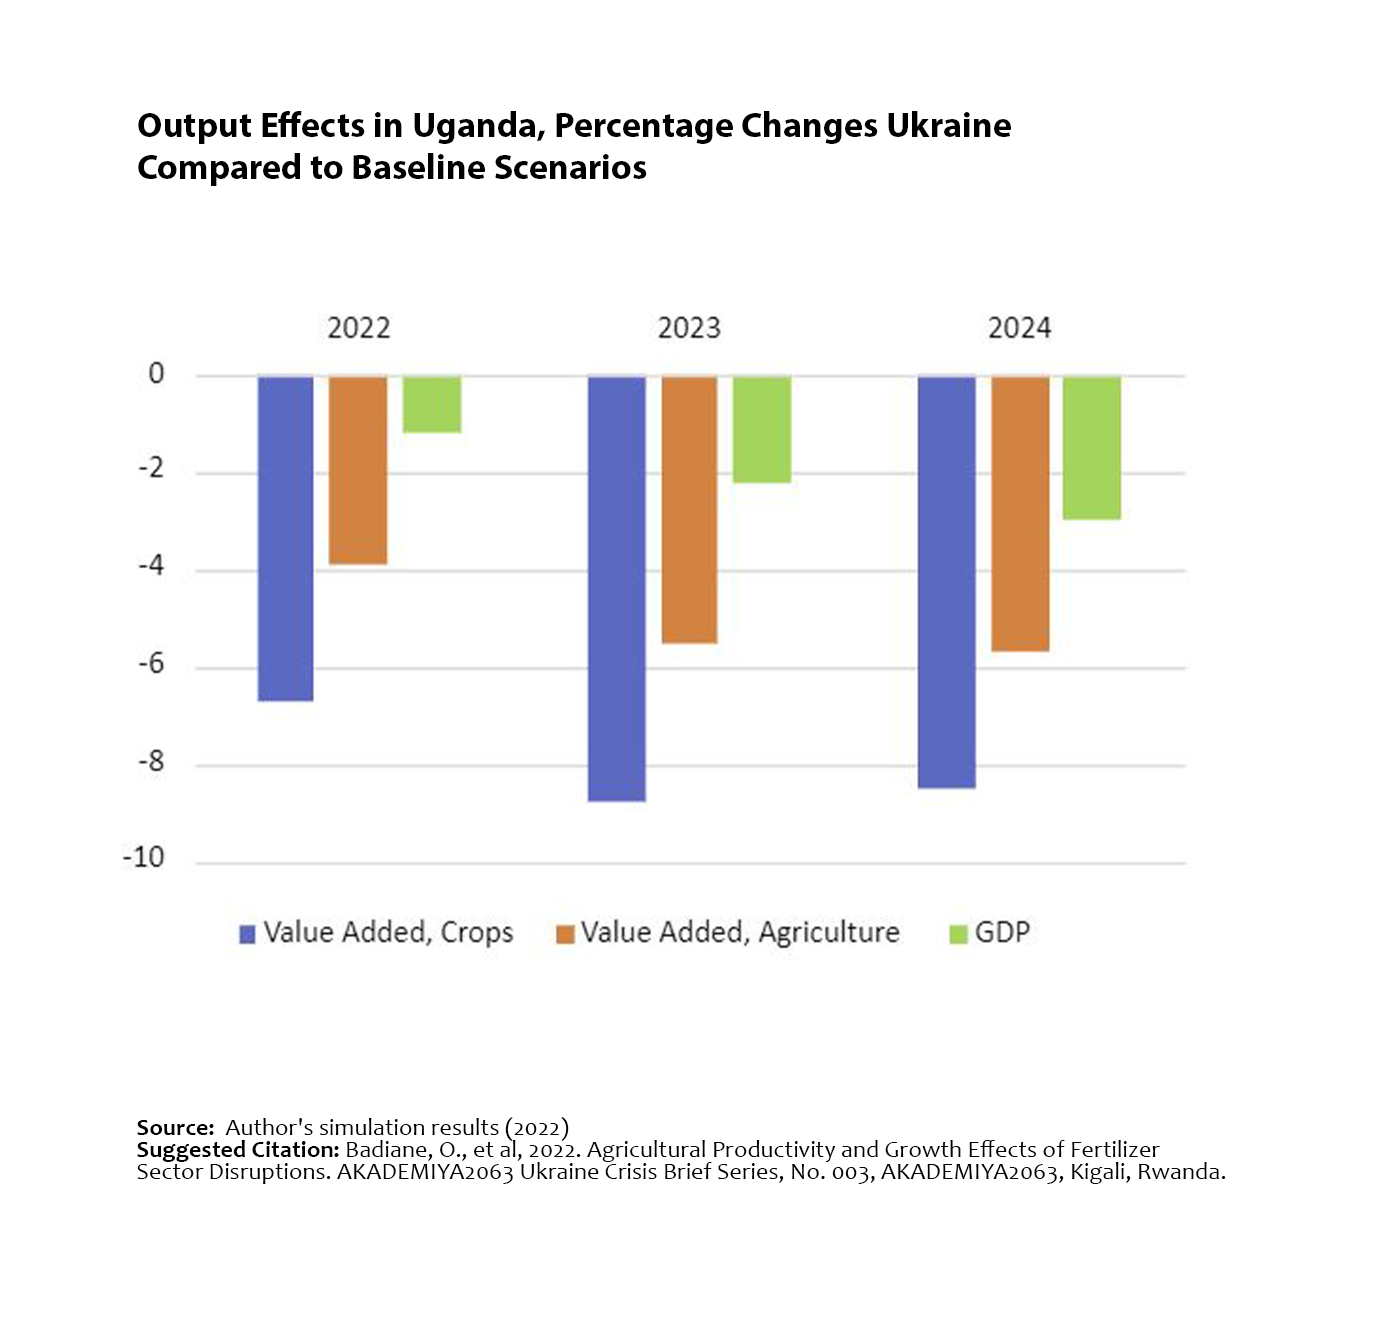
Output Effects in Uganda, Percentage Changes Ukraine Compared to Baseline Scenarios
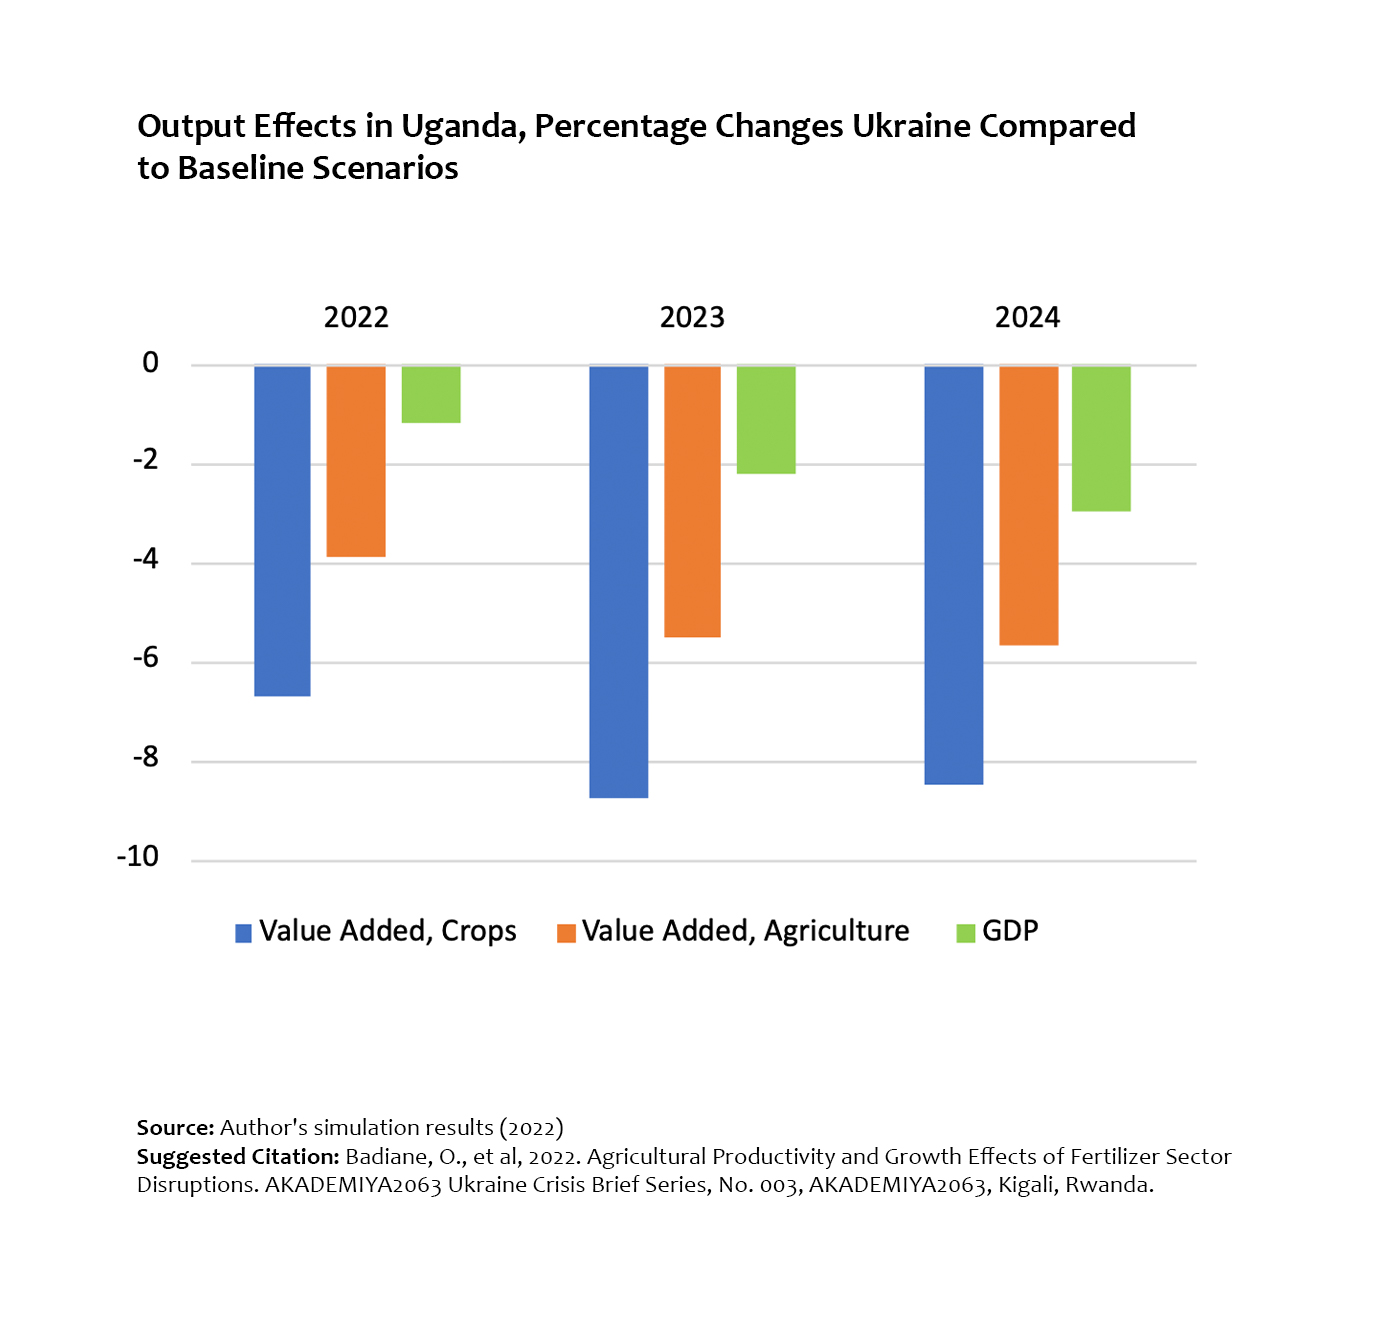
Output Effects in Uganda, Percentage Changes Ukraine Compared to Baseline Scenarios
Average regional trade overlap indicator values, 2011-2020
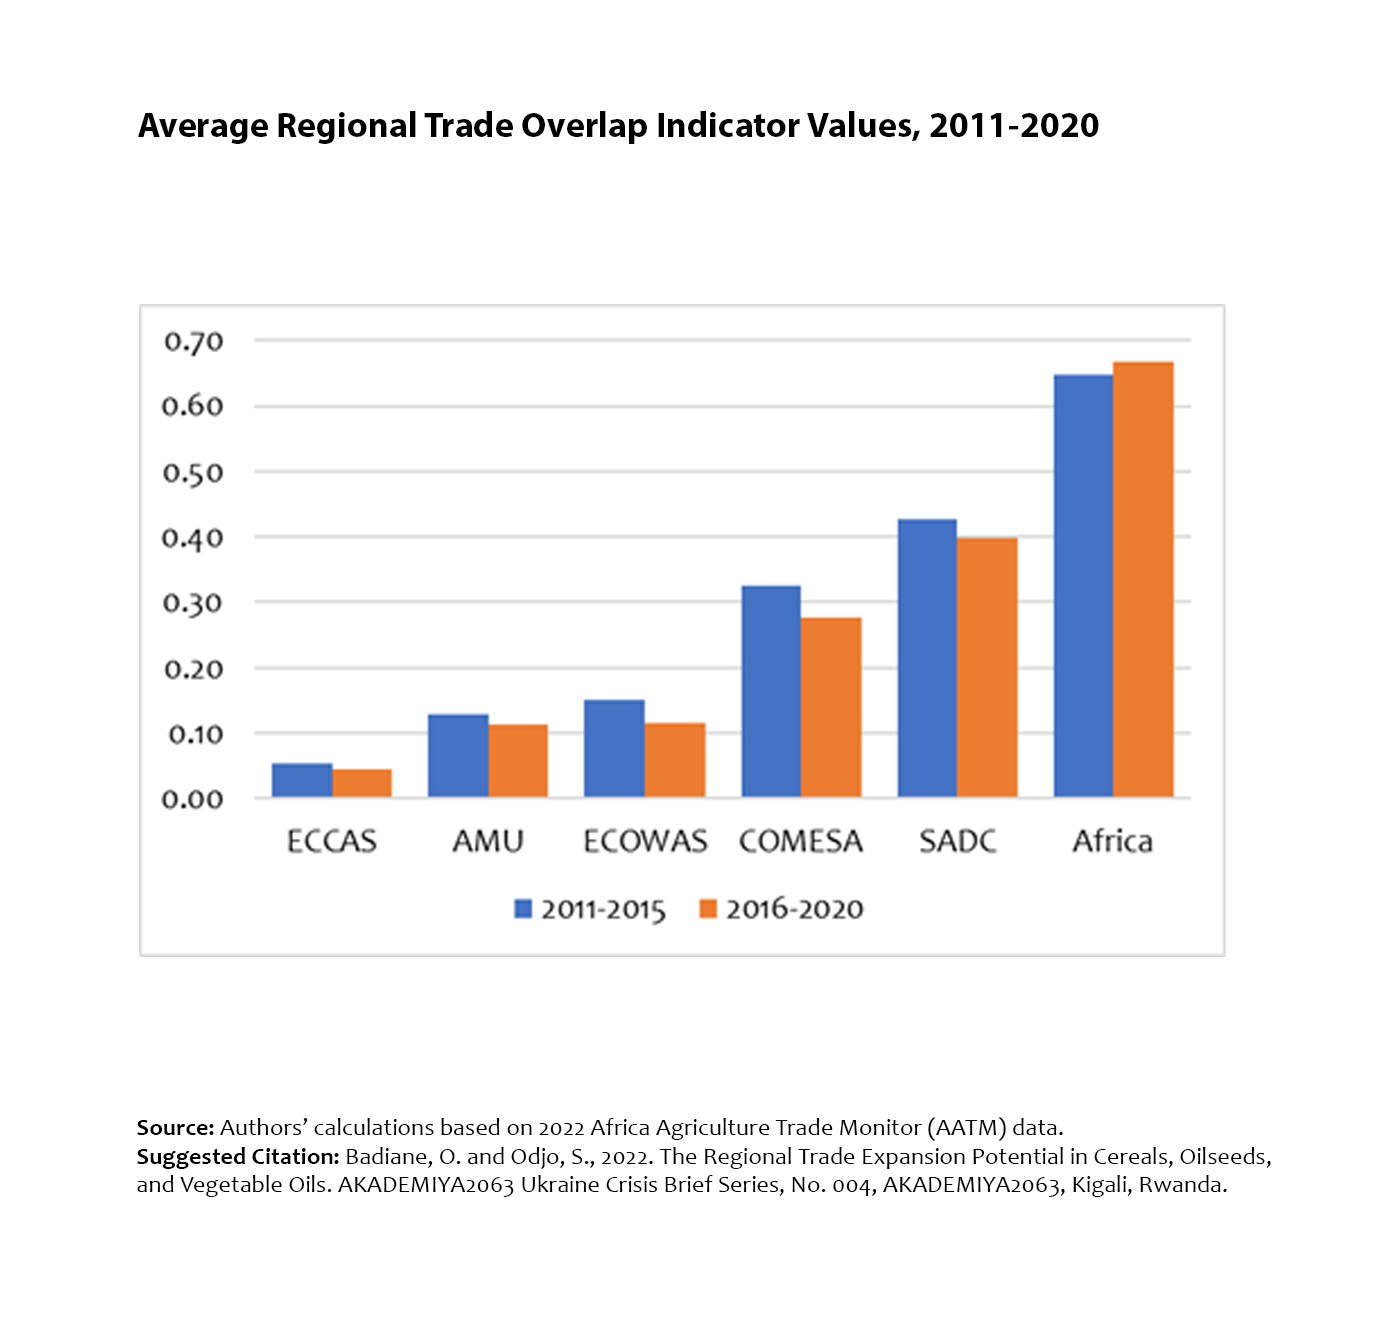
Average regional trade overlap indicator values, 2011-2020
Normalized average trade overlap indicators by country, 2011-2020
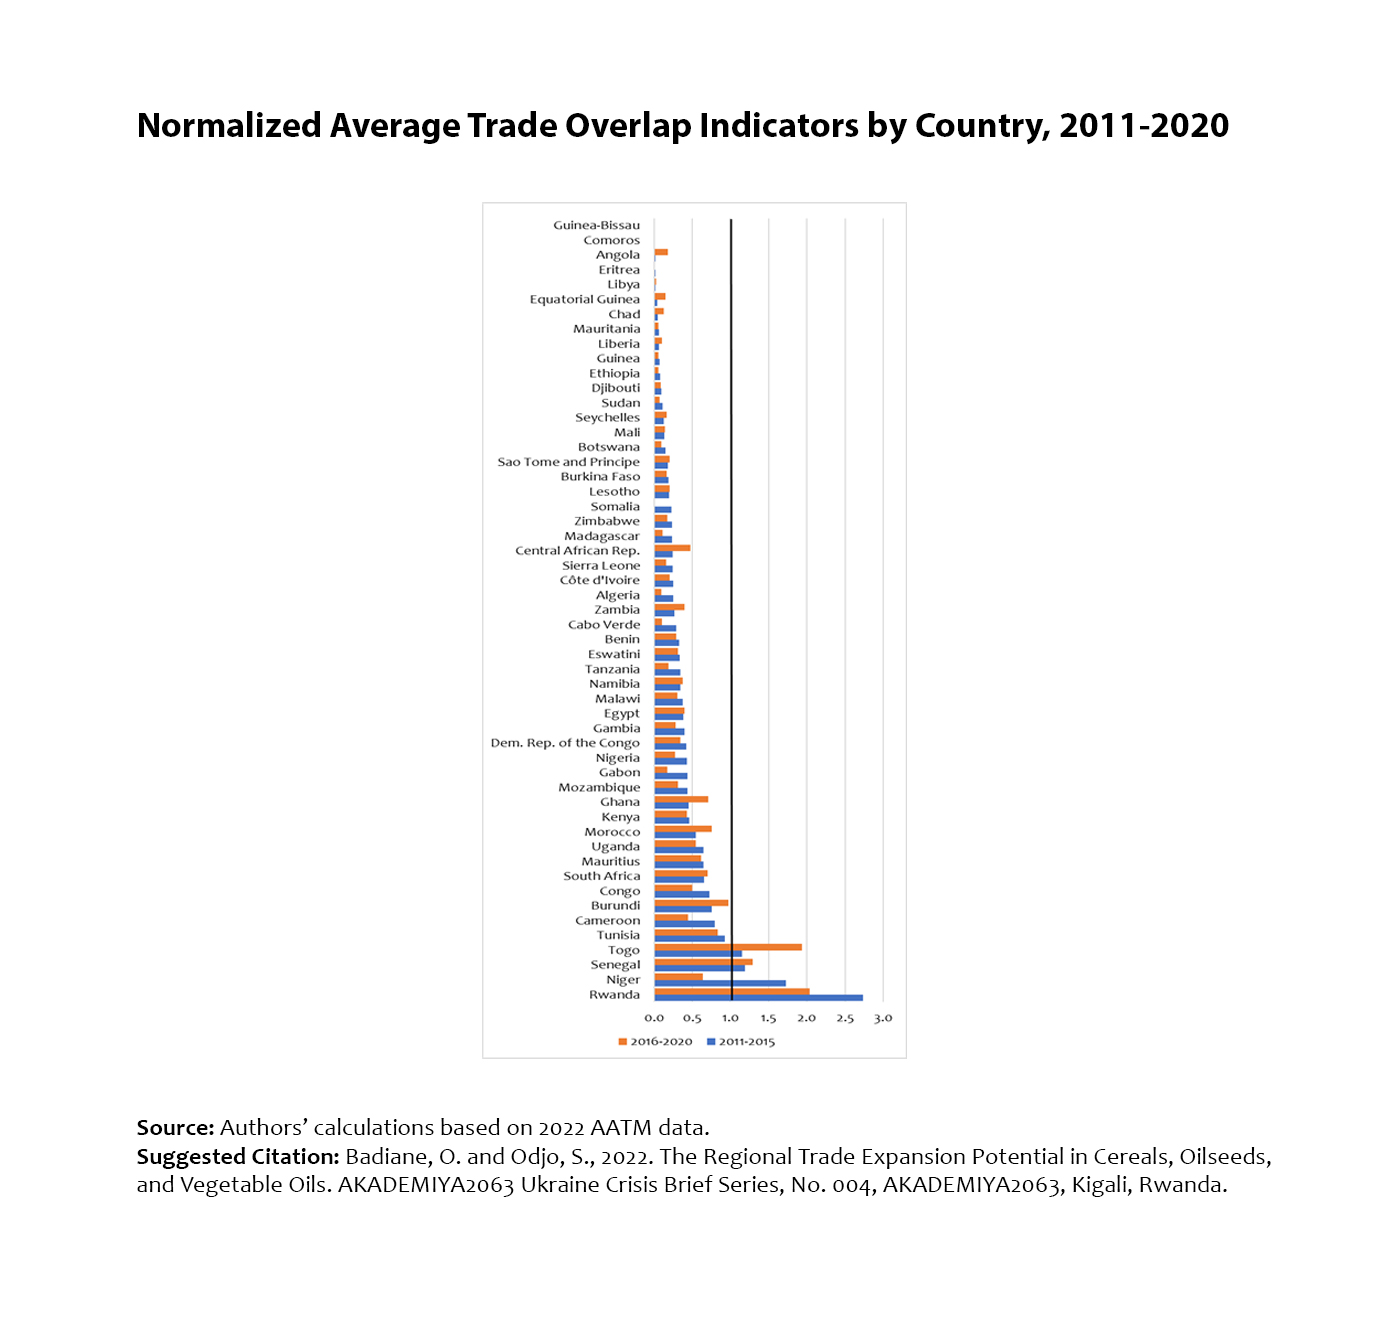
Normalized average trade overlap indicators by country, 2011-2020
Distribution of average TEI values by product group in Africa, 2016-2020
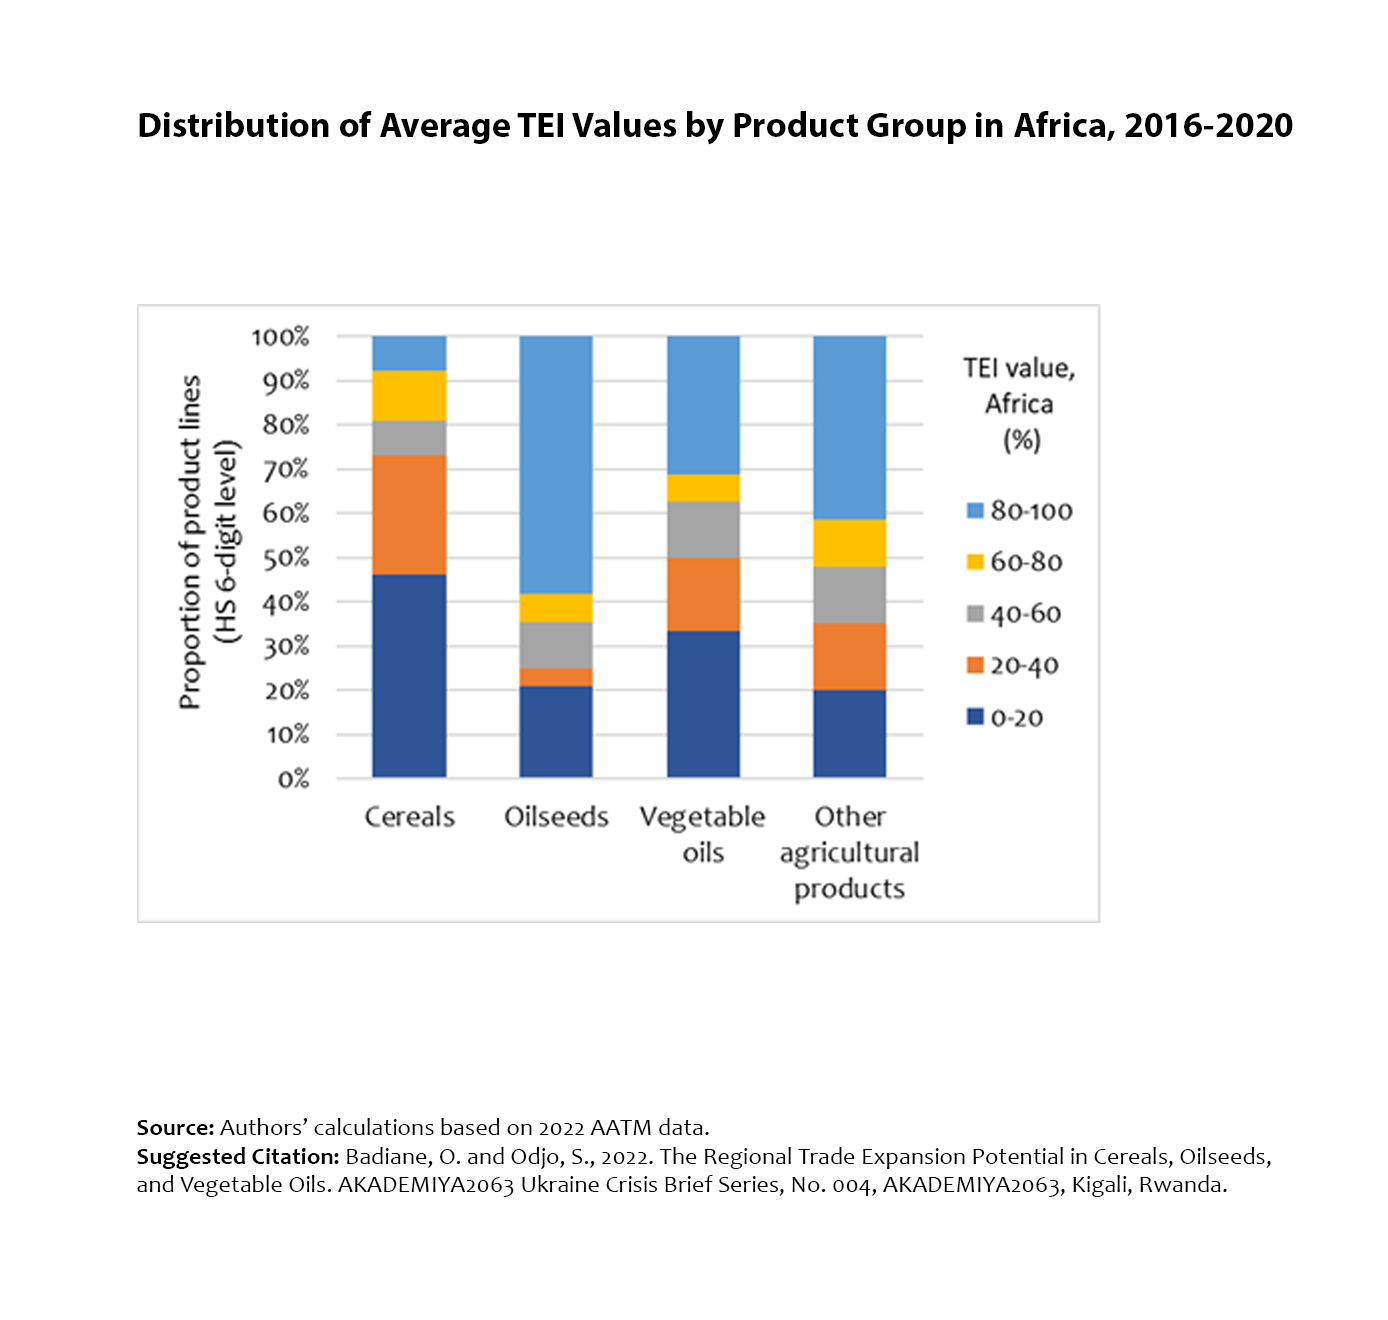
Distribution of average TEI values by product group in Africa, 2016-2020
Distribution of average TEI values by product group, ECOWAS region, 2016-2020
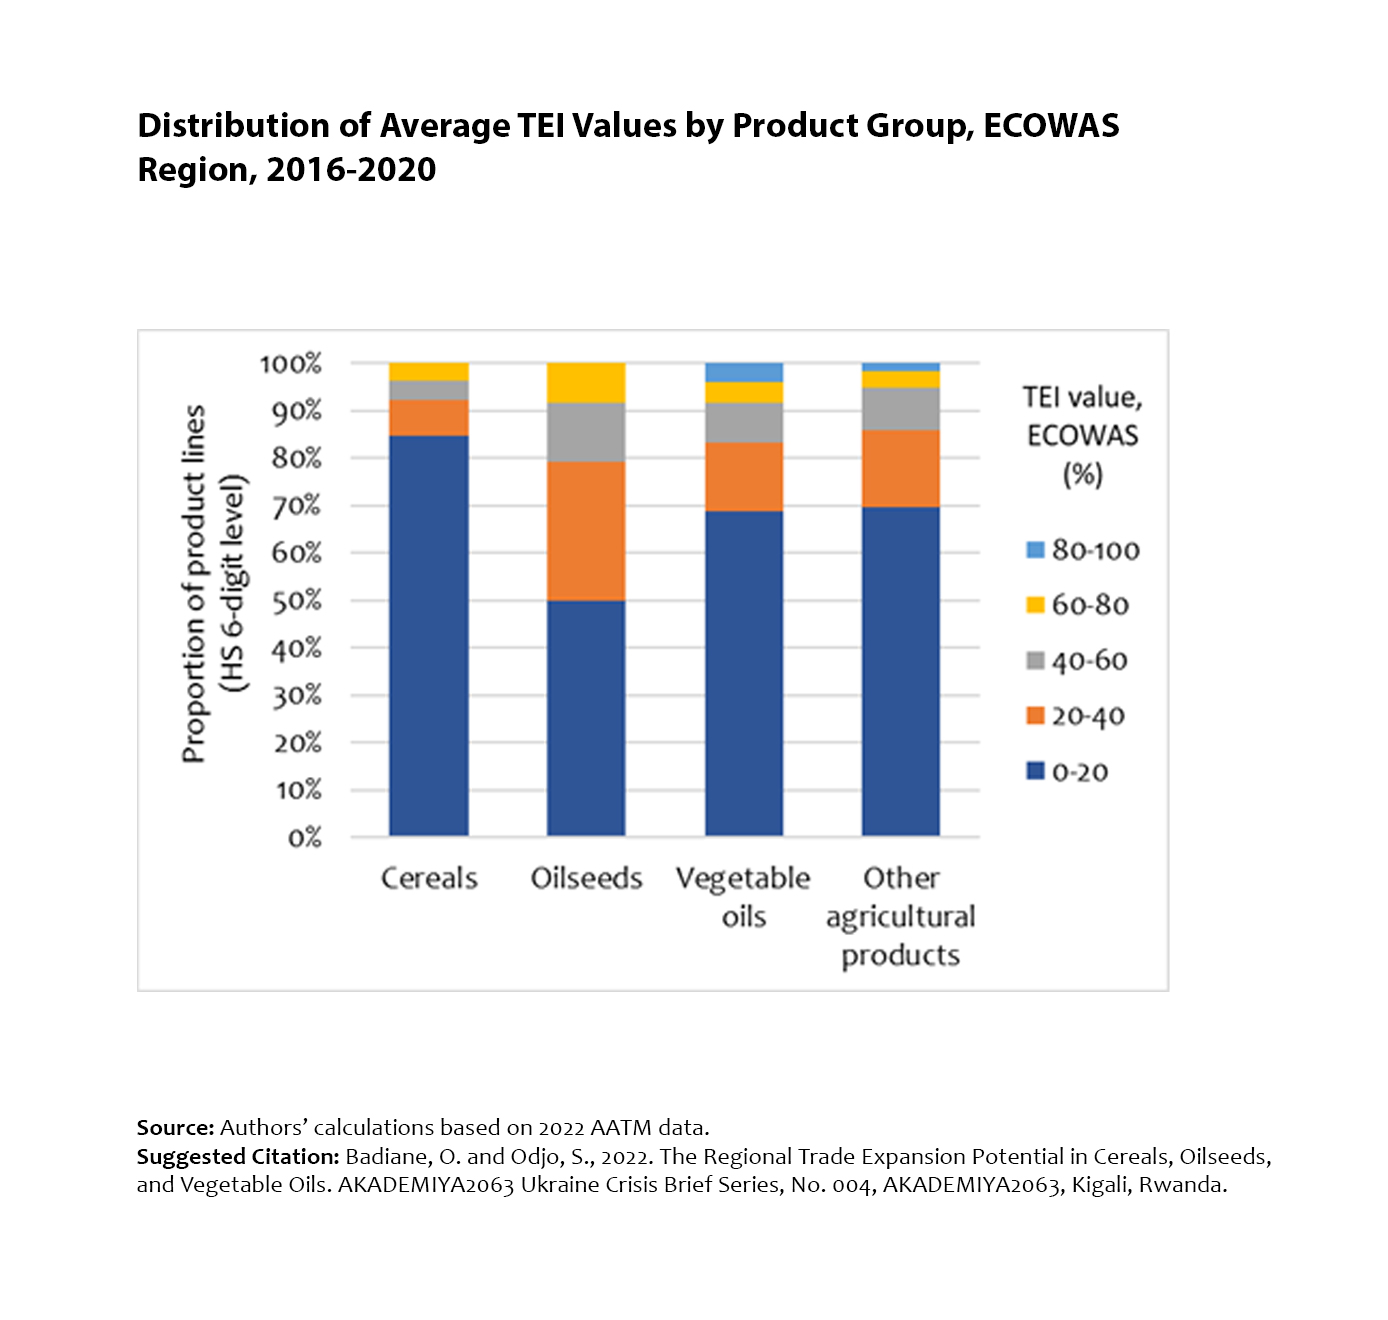
Distribution of average TEI values by product group, ECOWAS region, 2016-2020
Distribution of average TEI values by product group, ECCAS region, 2016-2020
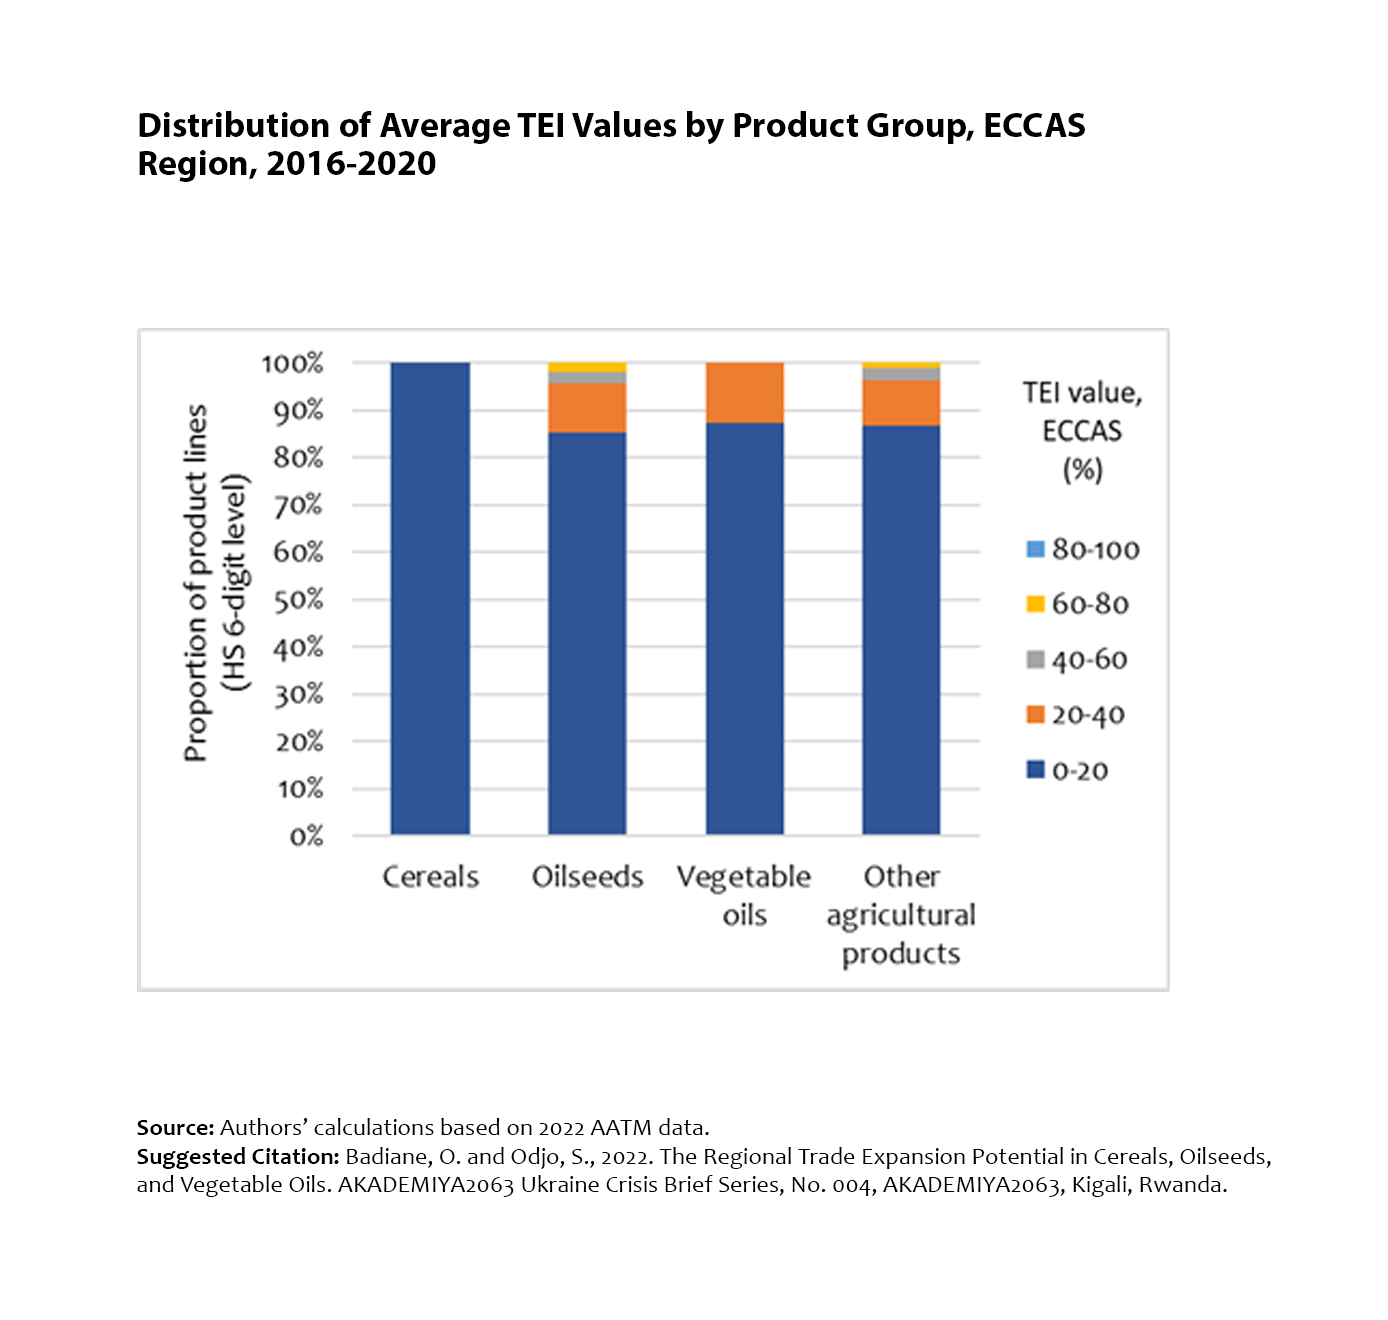
Distribution of average TEI values by product group, ECCAS region, 2016-2020
Distribution of average TEI values by product group, COMESA region, 2016-2020
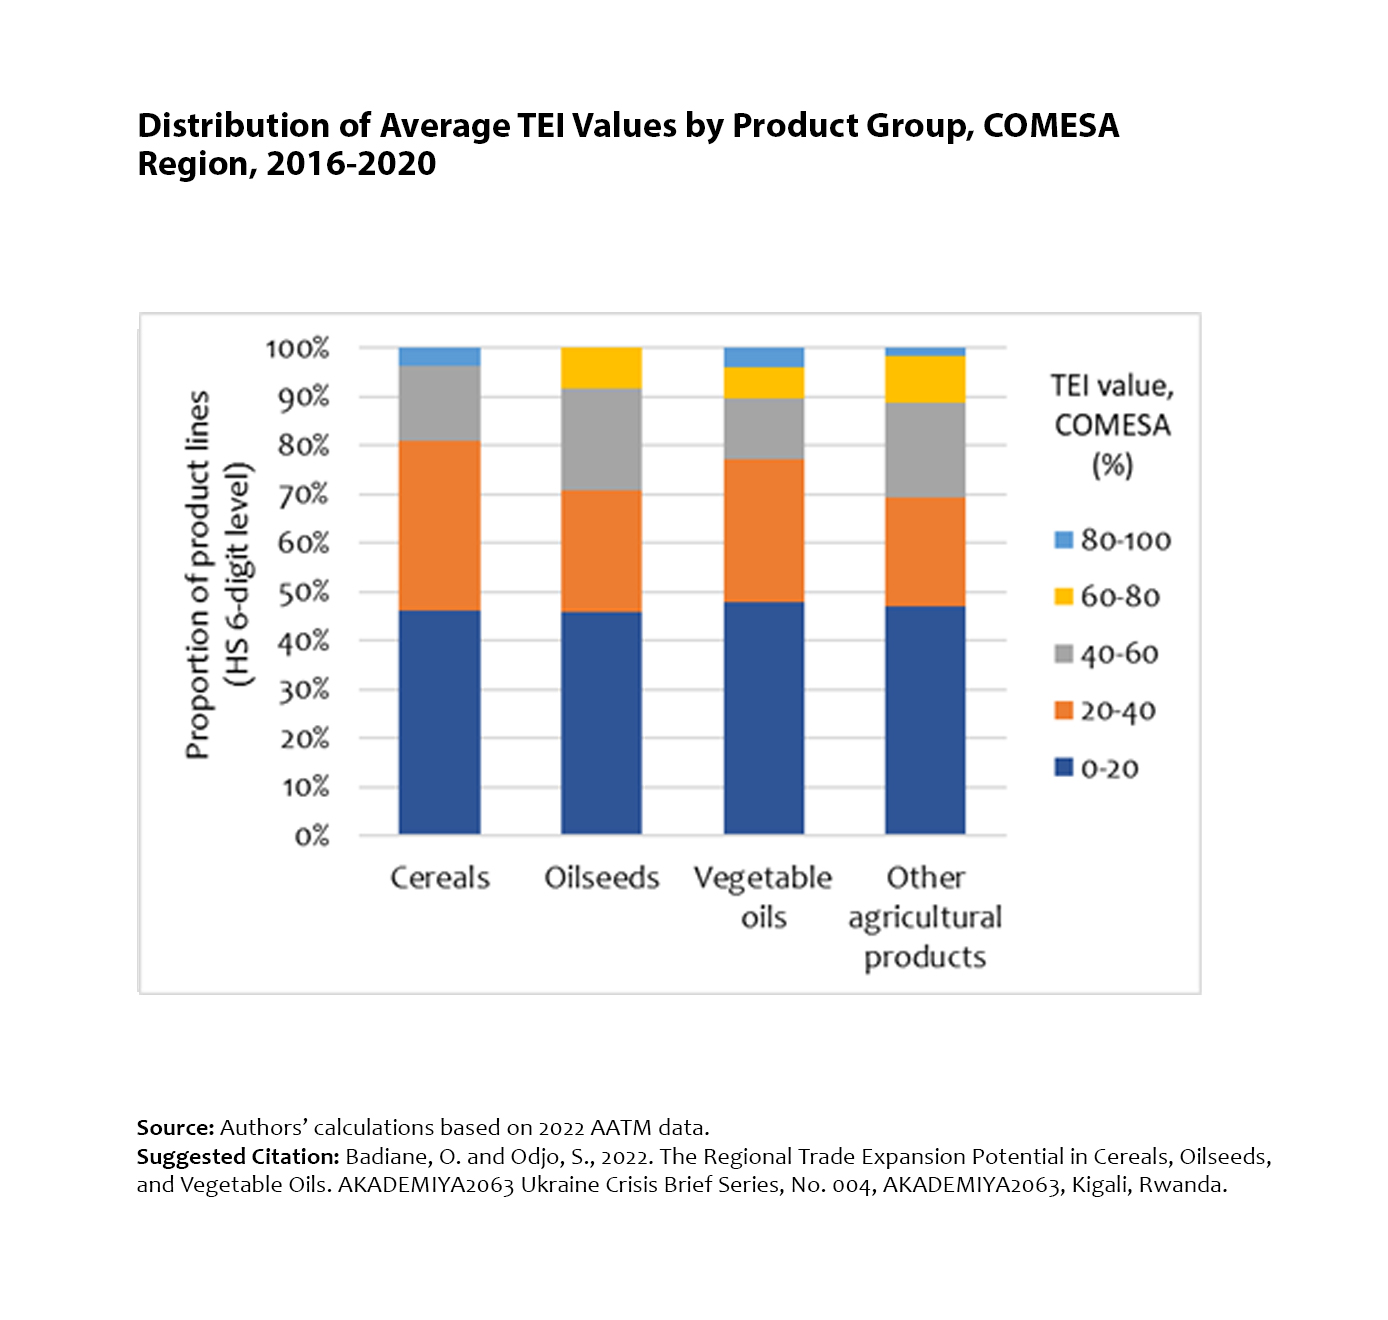
Distribution of average TEI values by product group, COMESA region, 2016-2020
Distribution of average TEI values by product group, SADC region, 2016-2020
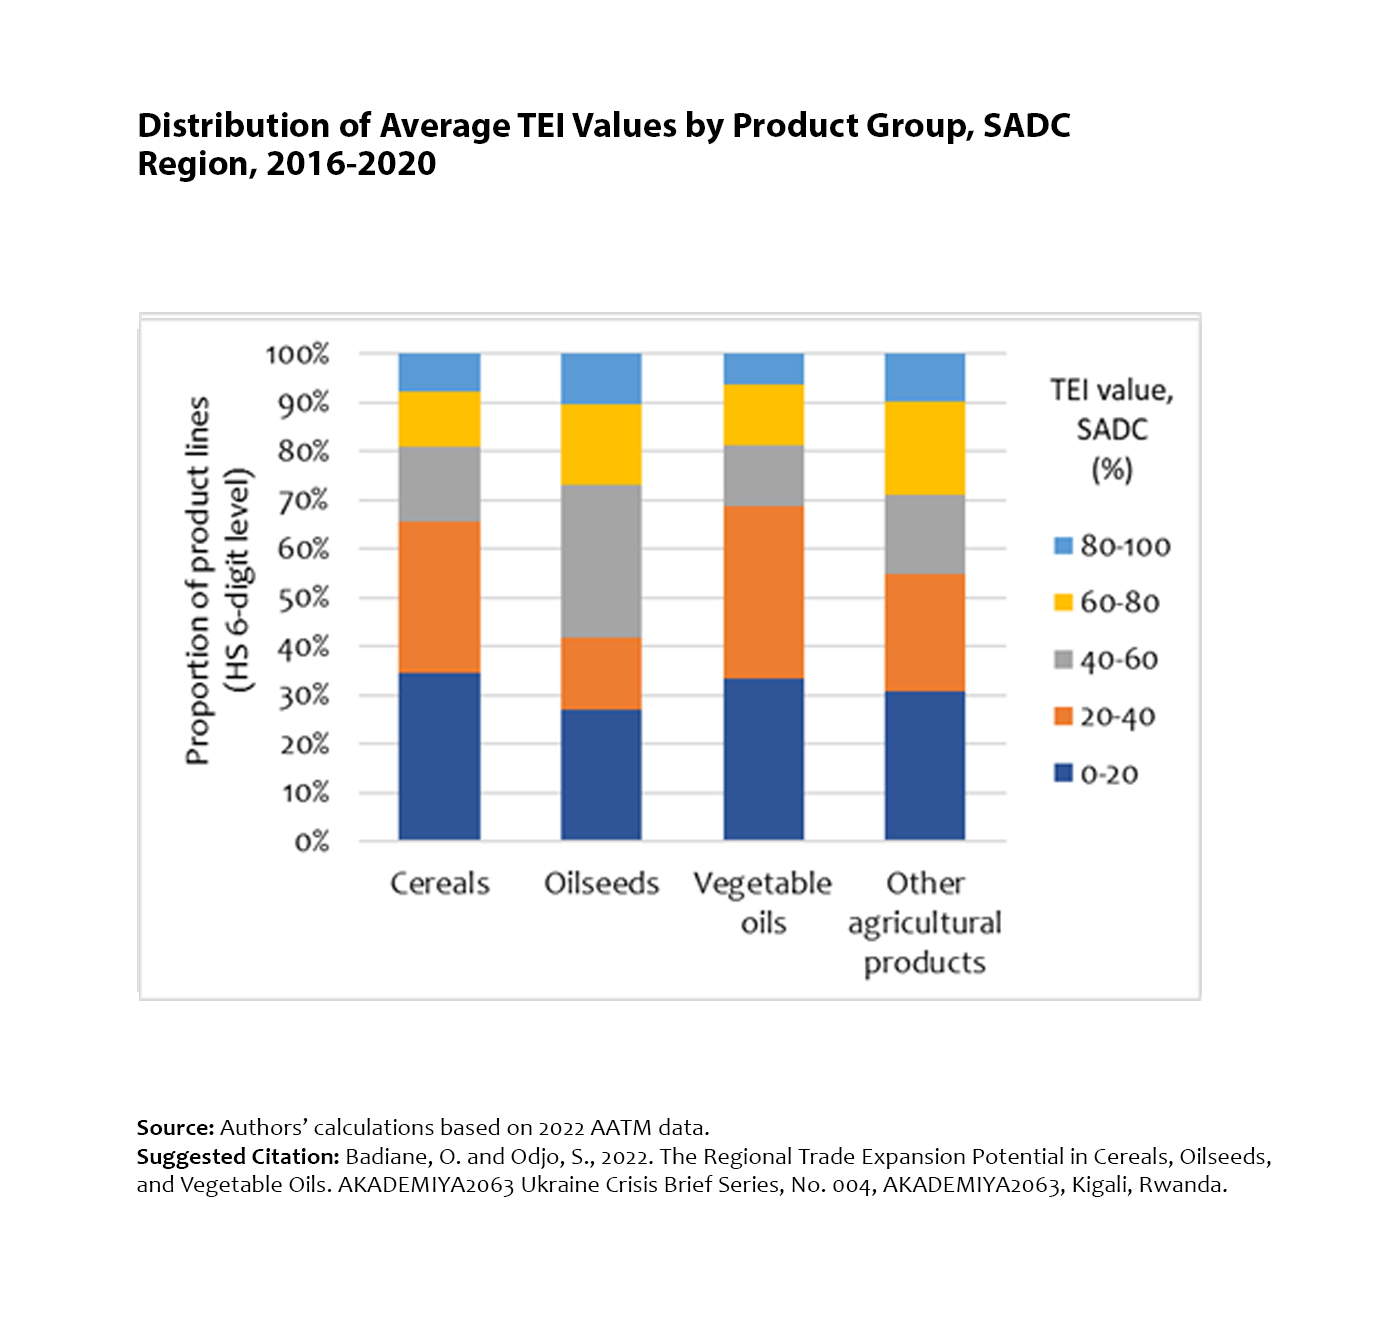
Distribution of average TEI values by product group, SADC region, 2016-2020
Distribution of average TEI values by product group, AMU region, 2016-2020
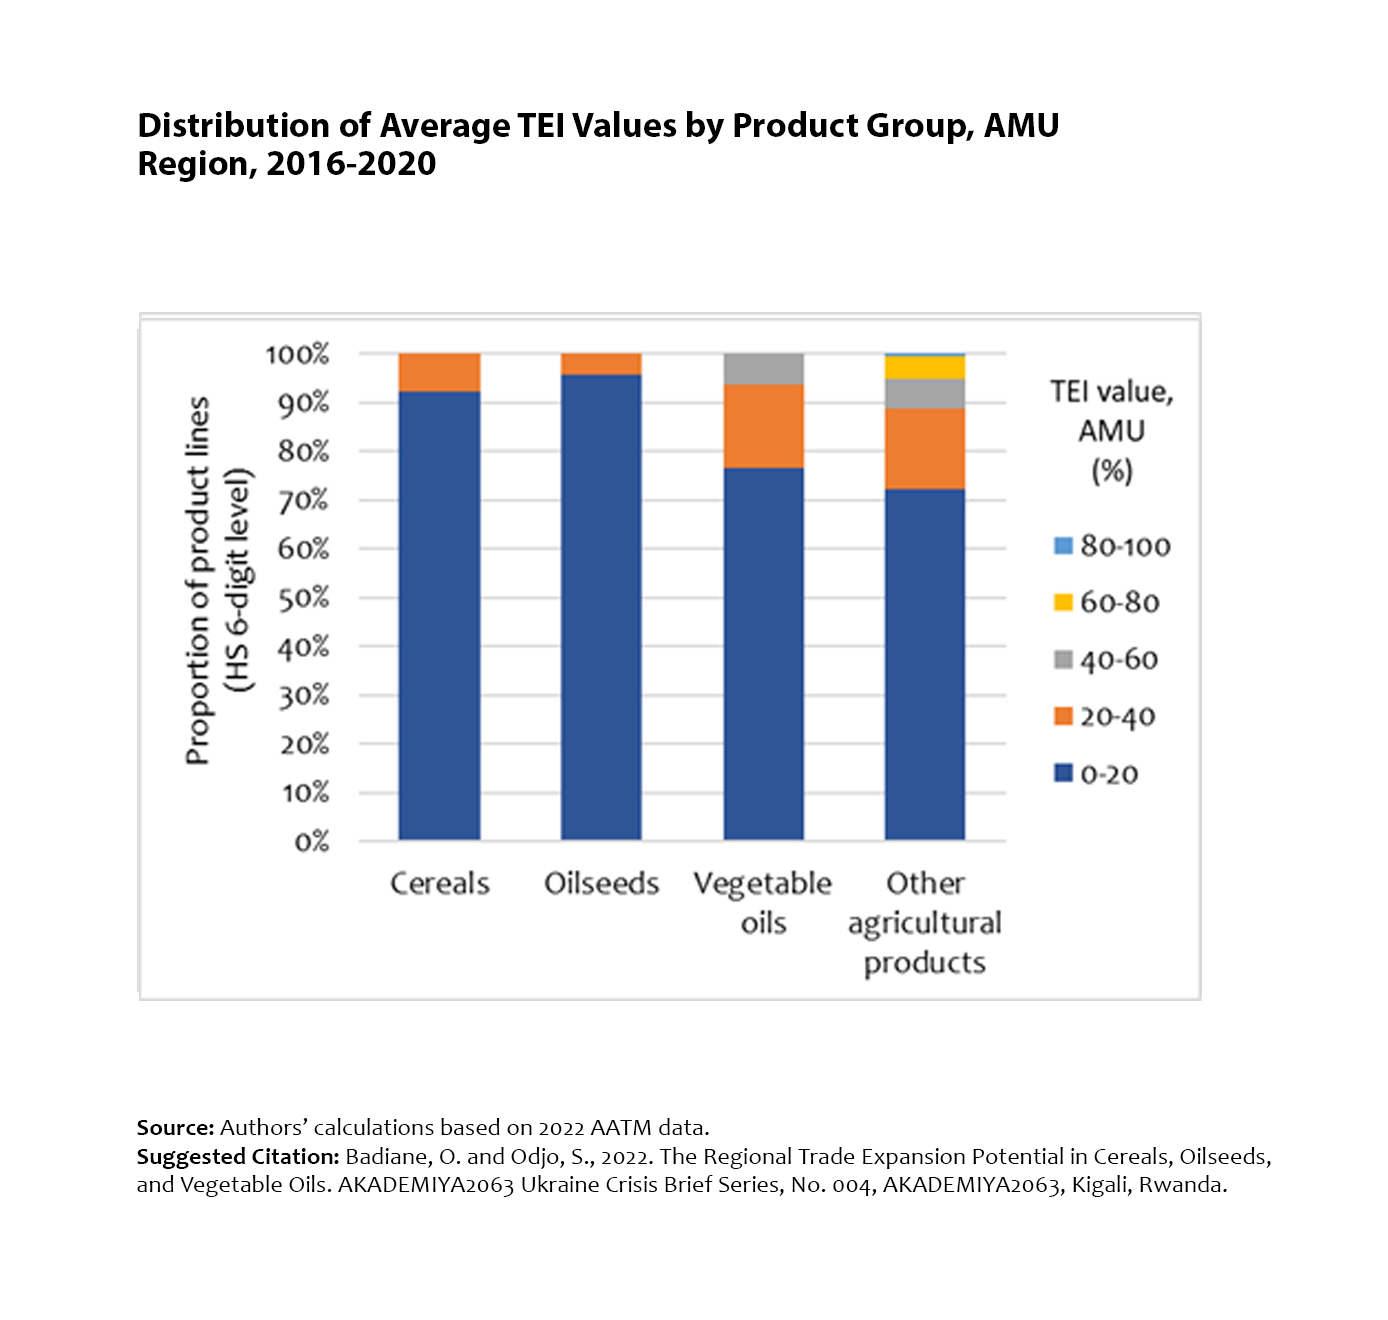
Distribution of average TEI values by product group, AMU region, 2016-2020
Projected changes in global prices by the World Bank, October 2021, (%)
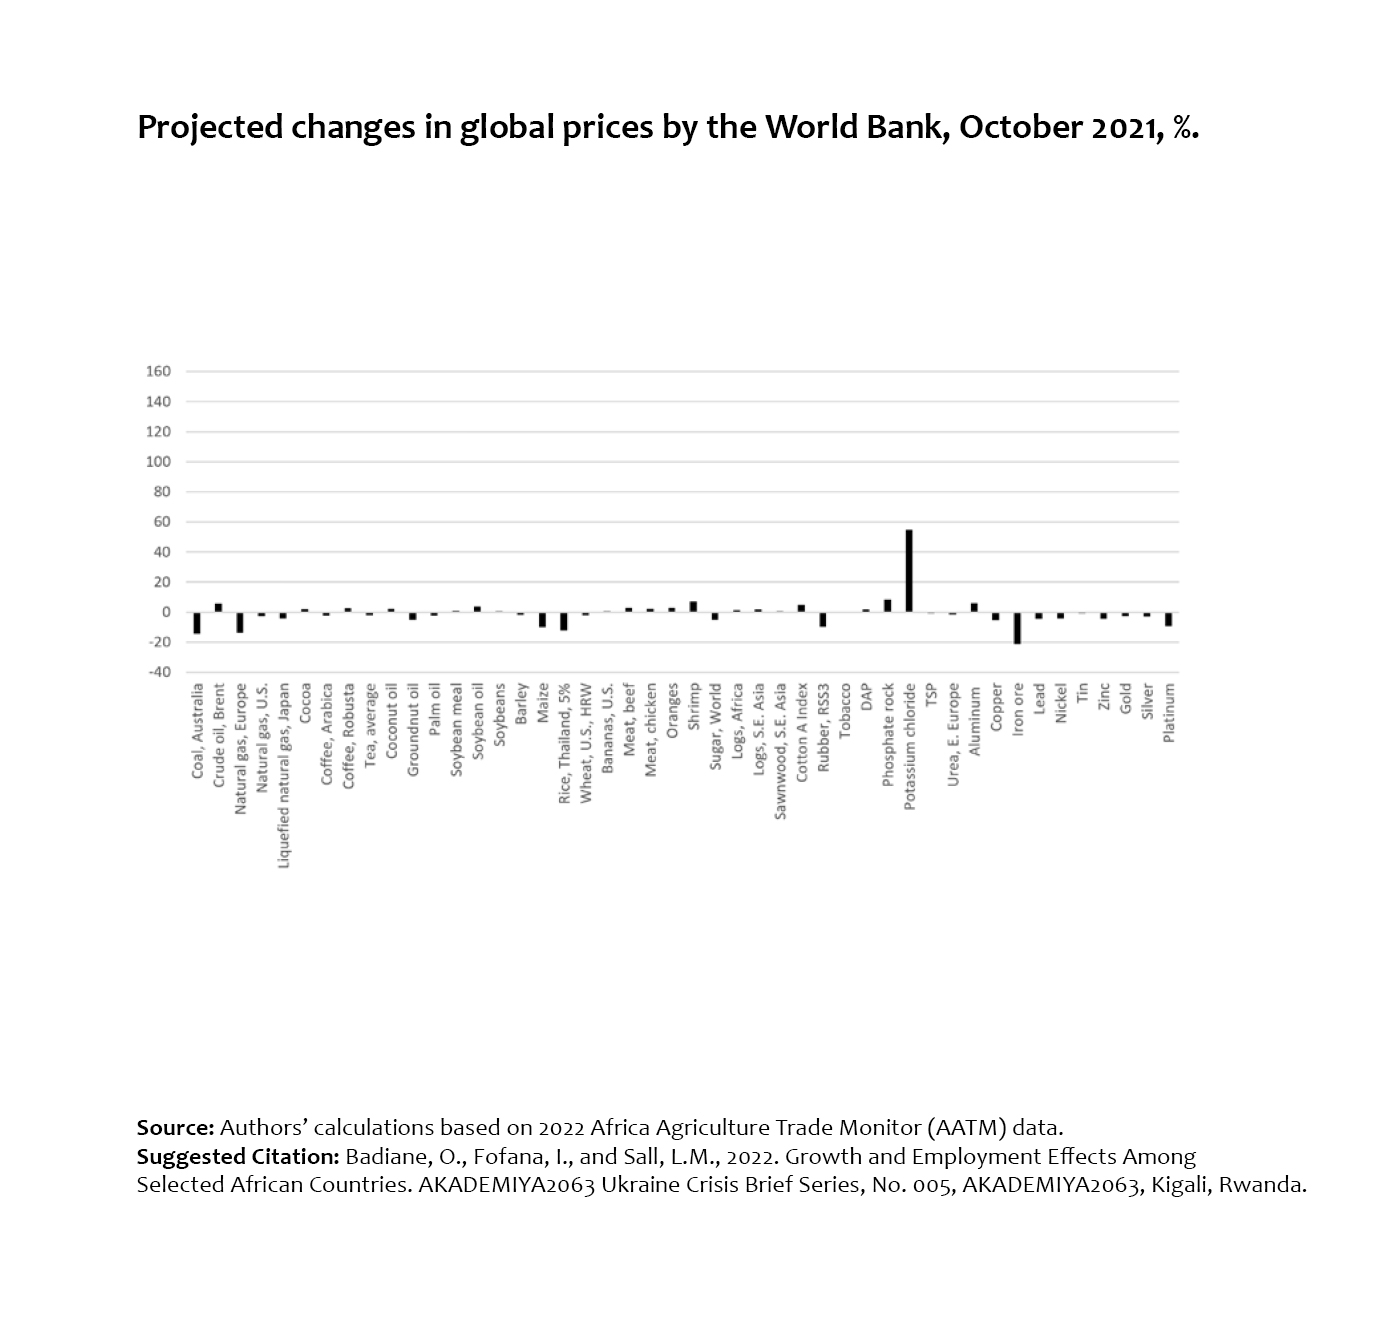
Projected changes in global prices by the World Bank, October 2021, (%)
Projected changes in global prices by the World Bank, April 2022, (%)
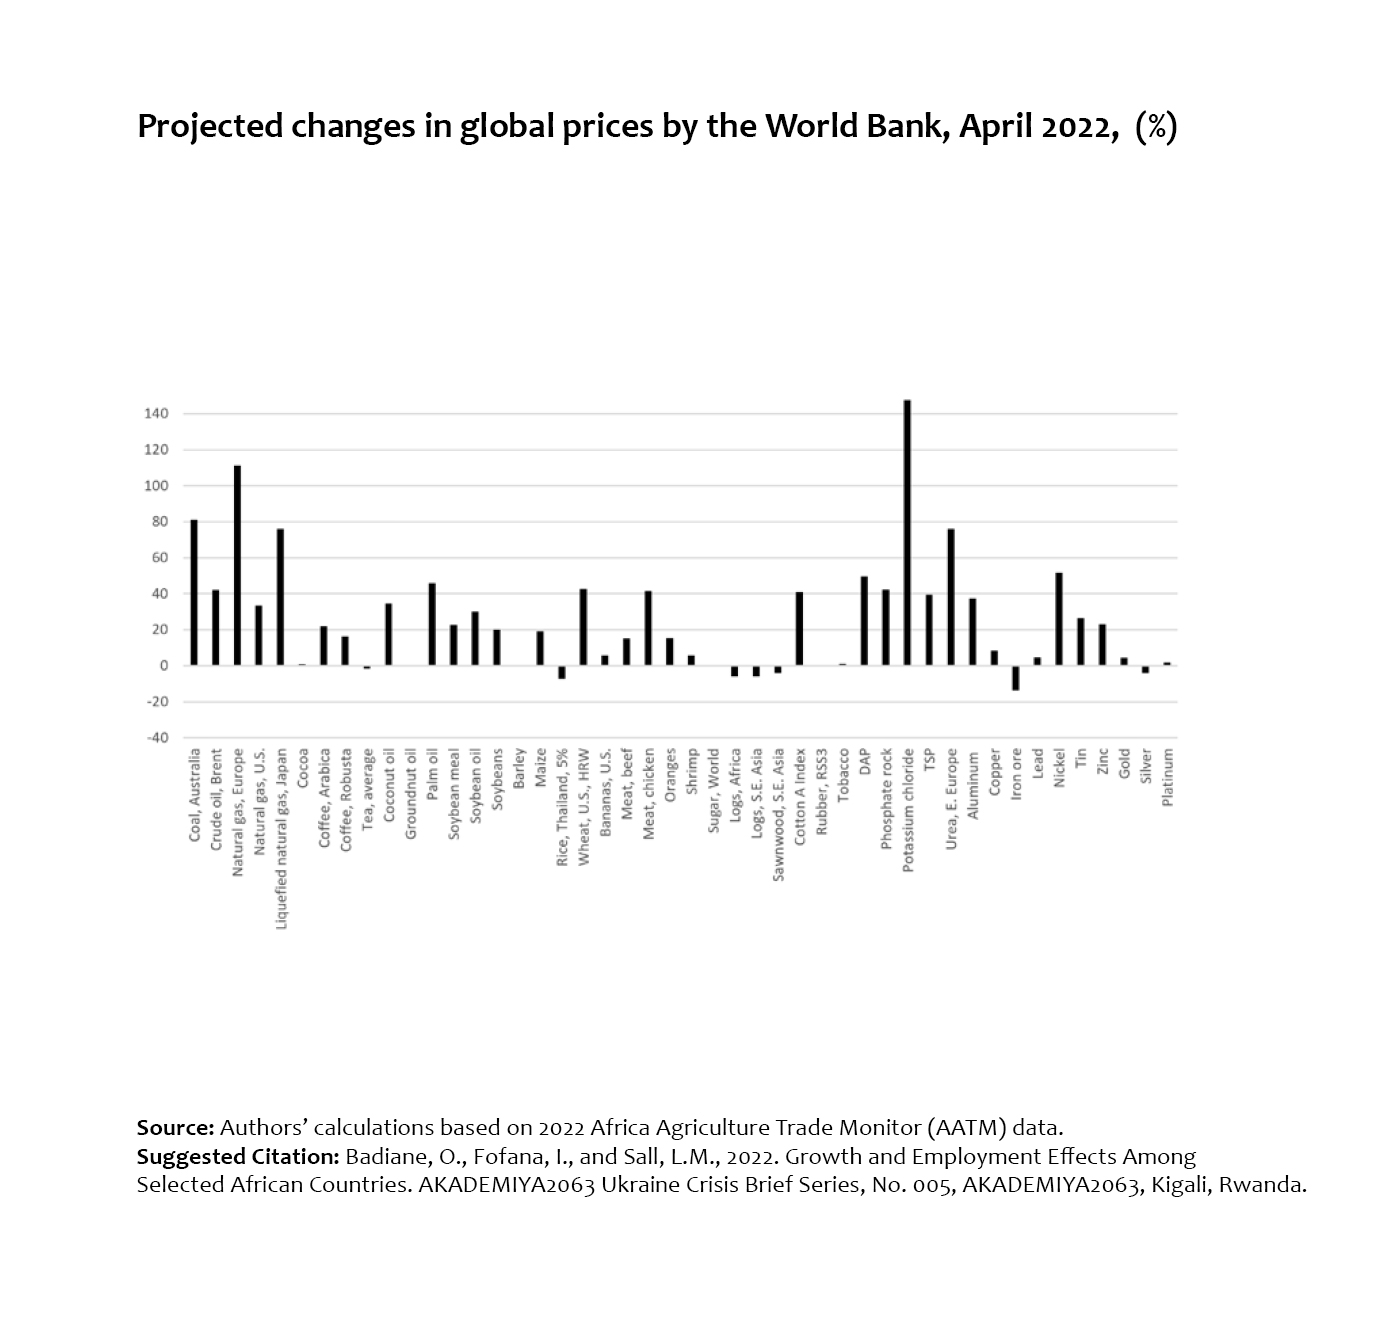
Projected changes in global prices by the World Bank, April 2022, (%)
Trade Effects in Countries Facing Deteriorating TOT - Changes in Price Indices,
percentage points (Kenya)
.jpg)
Trade Effects in Countries Facing Deteriorating TOT - Changes in Price Indices, percentage points (Kenya)
Trade Effects in Countries Facing Deteriorating TOT - Changes in Imports and Exports vs
Baseline (Kenya)
.jpg)
Trade Effects in Countries Facing Deteriorating TOT - Changes in Imports and Exports vs Baseline (Kenya)
Trade Effects in Countries Facing Deteriorating TOT - Changes in Price Indices,
percentage points (Malawi)
.jpg)
Trade Effects in Countries Facing Deteriorating TOT - Changes in Price Indices, percentage points (Malawi)
Trade Effects in Countries Facing Deteriorating TOT - Changes in Imports and Exports vs
Baseline (Malawi)
.jpg)
Trade Effects in Countries Facing Deteriorating TOT - Changes in Imports and Exports vs Baseline (Malawi)
Trade Effects in Countries Facing Deteriorating TOT - Changes in Price Indices,
percentage points (Senegal)
.jpg)
Trade Effects in Countries Facing Deteriorating TOT - Changes in Price Indices, percentage points (Senegal)
Trade Effects in Countries Facing Deteriorating TOT - Changes in Imports and Exports vs
Baseline (Senegal)
.jpg)
Trade Effects in Countries Facing Deteriorating TOT - Changes in Imports and Exports vs Baseline (Senegal)
Trade Effects in Countries Facing Deteriorating TOT - Changes in Price Indices,
percentage points (Tanzania)
.jpg)
Trade Effects in Countries Facing Deteriorating TOT - Changes in Price Indices, percentage points (Tanzania)
Trade Effects in Countries Facing Deteriorating TOT - Changes in Imports and Exports vs
Baseline (Tanzania)
.jpg)
Trade Effects in Countries Facing Deteriorating TOT - Changes in Imports and Exports vs Baseline (Tanzania)
Trade Effects in Countries Facing Deteriorating TOT - Changes in Price Indices,
percentage points (Uganda)
.jpg)
Trade Effects in Countries Facing Deteriorating TOT - Changes in Price Indices, percentage points (Uganda)
Trade Effects in Countries Facing Deteriorating TOT - Changes in Imports and Exports vs
Baseline (Uganda)
.jpg)
Trade Effects in Countries Facing Deteriorating TOT - Changes in Imports and Exports vs Baseline (Uganda)
Trade Effects in Countries Anticipating Improving TOT - Changes in Price Indices,
percentage points (Benin)
.jpg)
Trade Effects in Countries Anticipating Improving TOT - Changes in Price Indices, percentage points (Benin)
Trade Effects in Countries Anticipating Improving TOT - Changes in Imports and Exports
vs Baseline (Benin)
.jpg)
Trade Effects in Countries Anticipating Improving TOT - Changes in Imports and Exports vs Baseline (Benin)
Trade Effects in Countries Anticipating Improving TOT - Changes in Price Indices,
percentage points (Ghana)
.jpg)
Trade Effects in Countries Anticipating Improving TOT - Changes in Price Indices, percentage points (Ghana)
Trade Effects in Countries Anticipating Improving TOT - Changes in Imports and Exports
vs Baseline (Ghana)
.jpg)
Trade Effects in Countries Anticipating Improving TOT - Changes in Imports and Exports vs Baseline (Ghana)
Trade Effects in Countries Anticipating Improving TOT - Changes in Price Indices,
percentage points (Mozambique)
.jpg)
Trade Effects in Countries Anticipating Improving TOT - Changes in Price Indices, percentage points (Mozambique)
Trade Effects in Countries Anticipating Improving TOT - Changes in Imports and Exports
vs Baseline (Mozambique)
.jpg)
Trade Effects in Countries Anticipating Improving TOT - Changes in Imports and Exports vs Baseline (Mozambique)
Trade Effects in Countries Anticipating Improving TOT - Changes in Price Indices,
percentage points (Nigeria)
.jpg)
Trade Effects in Countries Anticipating Improving TOT - Changes in Price Indices, percentage points (Nigeria)
Trade Effects in Countries Anticipating Improving TOT - Changes in Imports and Exports
vs Baseline (Nigeria)
.jpg)
Trade Effects in Countries Anticipating Improving TOT - Changes in Imports and Exports vs Baseline (Nigeria)
Trade Effects in Countries Anticipating Improving TOT - Changes in Price Indices,
percentage points (South Africa)
.jpg)
Trade Effects in Countries Anticipating Improving TOT - Changes in Price Indices, percentage points (South Africa)
Trade Effects in Countries Anticipating Improving TOT - Changes in Imports and Exports
vs Baseline (South Africa)
.jpg)
Trade Effects in Countries Anticipating Improving TOT - Changes in Imports and Exports vs Baseline (South Africa)
Employment Effects in Countries Facing Deteriorating TOT, Employment (%) - Kenya
 - Kenya.jpg)
Employment Effects in Countries Facing Deteriorating TOT, Employment (%) - Kenya
Employment Effects in Countries Facing Deteriorating TOT, Employment (million) - Kenya
 - Kenya.jpg)
Employment Effects in Countries Facing Deteriorating TOT, Employment (million) - Kenya
Employment Effects in Countries Facing Deteriorating TOT, Employment (%) - Malawi
 - Malawi.jpg)
Employment Effects in Countries Facing Deteriorating TOT, Employment (%) - Malawi
Employment Effects in Countries Facing Deteriorating TOT, Employment (million) - Malawi
 - Malawi.jpg)
Employment Effects in Countries Facing Deteriorating TOT, Employment (million) - Malawi
Employment Effects in Countries Facing Deteriorating TOT, Employment (%) - Senegal
 - Senegal.jpg)
Employment Effects in Countries Facing Deteriorating TOT, Employment (%) - Senegal
Employment Effects in Countries Facing Deteriorating TOT, Employment (million) - Senegal
 - Senegal.jpg)
Employment Effects in Countries Facing Deteriorating TOT, Employment (million) - Senegal
Employment Effects in Countries Facing Deteriorating TOT, Employment (%) - Tanzania
 - Tanzania.jpg)
Employment Effects in Countries Facing Deteriorating TOT, Employment (%) - Tanzania
Employment Effects in Countries Facing Deteriorating TOT, Employment (%) - Uganda
 - Uganda.jpg)
Employment Effects in Countries Facing Deteriorating TOT, Employment (%) - Uganda
Employment Effects in Countries Facing Deteriorating TOT, Employment (million) - Uganda
 - Uganda.jpg)
Employment Effects in Countries Facing Deteriorating TOT, Employment (million) - Uganda
Employment Effects in Countries Anticipating Improving TOT, Employment (%) - Benin
 - Benin.jpg)
Employment Effects in Countries Anticipating Improving TOT, Employment (%) - Benin
Employment Effects in Countries Anticipating Improving TOT, Employment (million) - Benin
 - Benin.jpg)
Employment Effects in Countries Anticipating Improving TOT, Employment (million) - Benin
Employment Effects in Countries Anticipating Improving TOT, Employment (%) - Ghana
 - Ghana.jpg)
Employment Effects in Countries Anticipating Improving TOT, Employment (%) - Ghana
Employment Effects in Countries Anticipating Improving TOT, Employment (%) - Mozambique
 - Mozambique.jpg)
Employment Effects in Countries Anticipating Improving TOT, Employment (%) - Mozambique
Employment Effects in Countries Anticipating Improving TOT, Employment (million) -
Mozambique
 - Mozambique.jpg)
Employment Effects in Countries Anticipating Improving TOT, Employment (million) - Mozambique
Employment Effects in Countries Anticipating Improving TOT, Employment (%) - Nigeria
 - Nigeria.jpg)
Employment Effects in Countries Anticipating Improving TOT, Employment (%) - Nigeria
Employment Effects in Countries Anticipating Improving TOT, Employment (million) -
Nigeria
 - Nigeria.jpg)
Employment Effects in Countries Anticipating Improving TOT, Employment (million) - Nigeria
Employment Effects in Countries Anticipating Improving TOT, Employment (%) - South
Africa
 - South Africa.jpg)
Employment Effects in Countries Anticipating Improving TOT, Employment (%) - South Africa
Employment Effects in Countries Anticipating Improving TOT, Employment (million) - South
Africa
 - South Africa.jpg)
Employment Effects in Countries Anticipating Improving TOT, Employment (million) - South Africa
World Bank Projection of Changes in Global Commodity Prices before and after the Ukraine
Crisis

World Bank Projection of Changes in Global Commodity Prices before and after the Ukraine Crisis
Change in Headcount Poverty Index compared to Baseline for TOTL countries (Malawi)
.jpg)
Change in Headcount Poverty Index compared to Baseline for TOTL countries (Malawi)
Change in Headcount Poverty Index compared to Baseline for TOTL countries (Kenya)
.jpg)
Change in Headcount Poverty Index compared to Baseline for TOTL countries (Kenya)
Change in Headcount Poverty Index compared to Baseline for TOTL countries (Senegal)
.jpg)
Change in Headcount Poverty Index compared to Baseline for TOTL countries (Senegal)
Change in Headcount Poverty Index compared to Baseline for TOTL countries (Tanzania)
.jpg)
Change in Headcount Poverty Index compared to Baseline for TOTL countries (Tanzania)
Change in Headcount Poverty Index compared to Baseline for TOTL countries (Uganda)
.jpg)
Change in Headcount Poverty Index compared to Baseline for TOTL countries (Uganda)
Change in Headcount Poverty Index compared to Baseline for TOTW countries (Benin)
.jpg)
Change in Headcount Poverty Index compared to Baseline for TOTW countries (Benin)
Change in Headcount Poverty Index compared to Baseline for TOTW countries (Nigeria)
.jpg)
Change in Headcount Poverty Index compared to Baseline for TOTW countries (Nigeria)
Change in Headcount Poverty Index compared to Baseline for TOTW countries (Ghana)
.jpg)
Change in Headcount Poverty Index compared to Baseline for TOTW countries (Ghana)
Change in Headcount Poverty Index compared to Baseline for TOTW countries (South Africa)
.jpg)
Change in Headcount Poverty Index compared to Baseline for TOTW countries (South Africa)
Change in Headcount Poverty Index compared to Baseline for TOTW countries (Mozambique)
.jpg)
Change in Headcount Poverty Index compared to Baseline for TOTW countries (Mozambique)
Changes in Global Vegetable Oils prices, (%)
.jpg)
Changes in Global Vegetable Oils prices, (%)
Degree of Import Dependency - Share of Ukraine and Russia in country imports
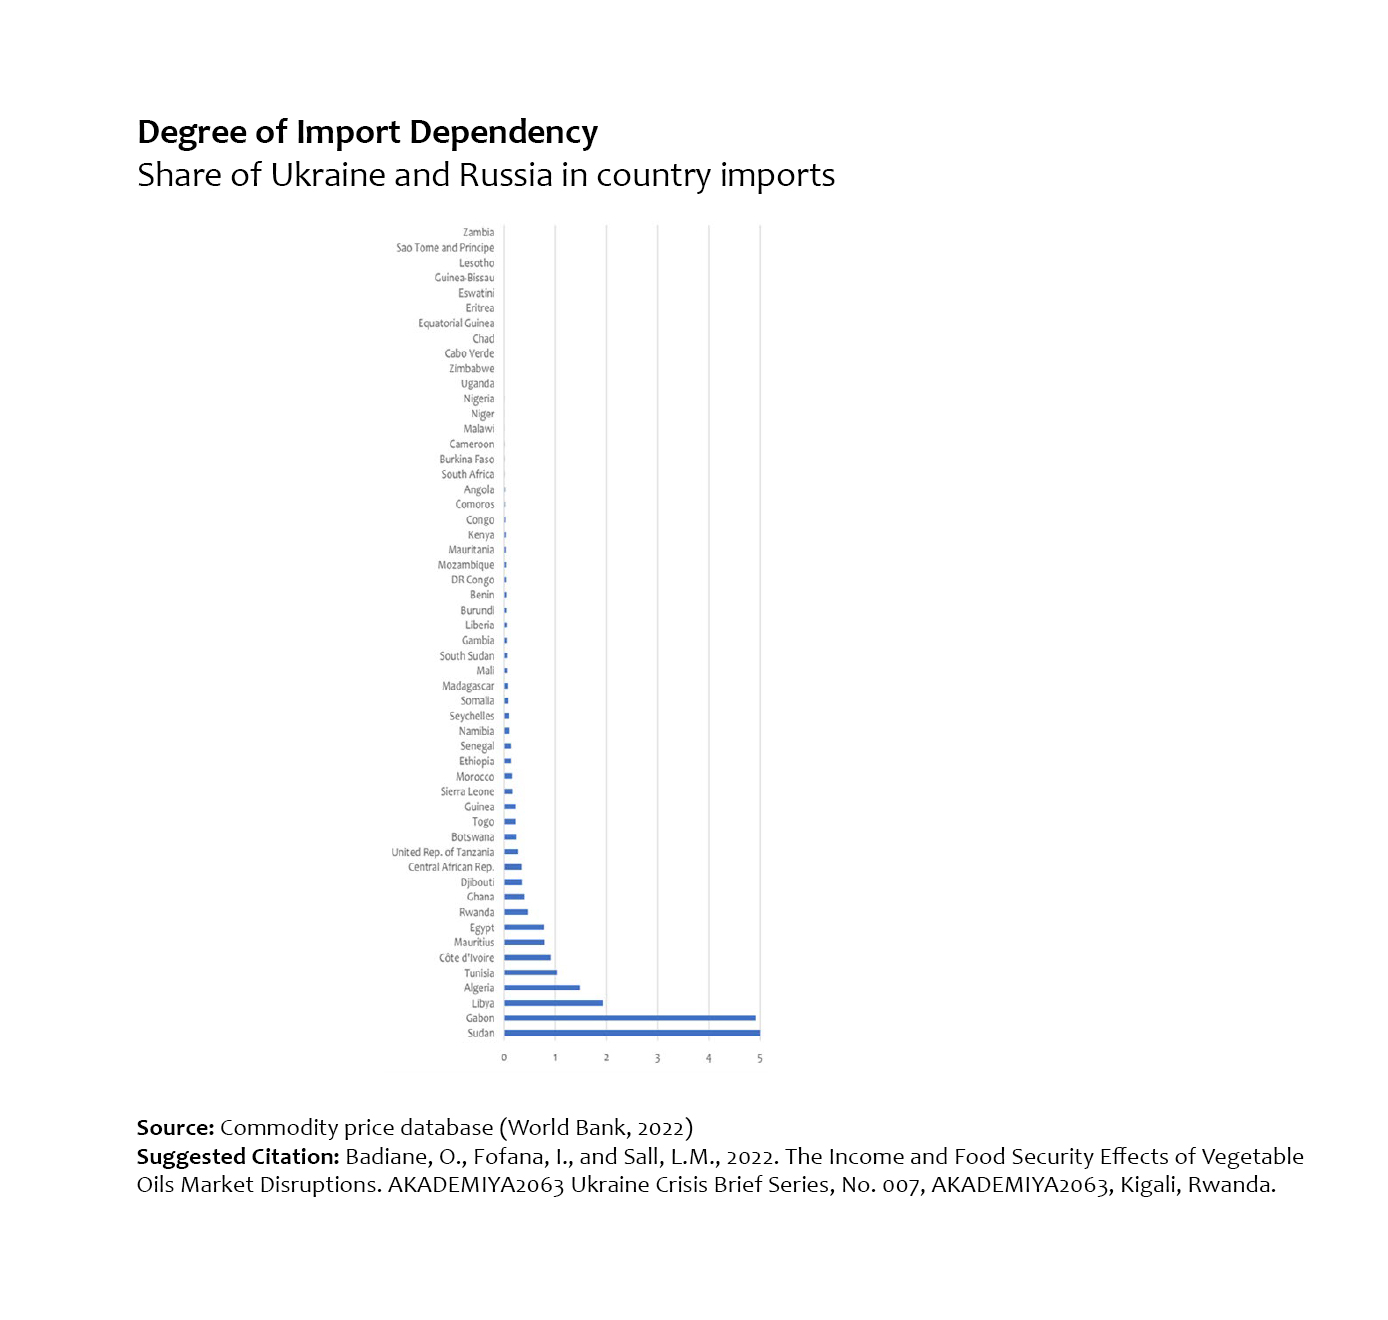
Degree of Import Dependency - Share of Ukraine and Russia in country imports
Import Penetration Rates - Share of vegetable oils imports in domestic consumption
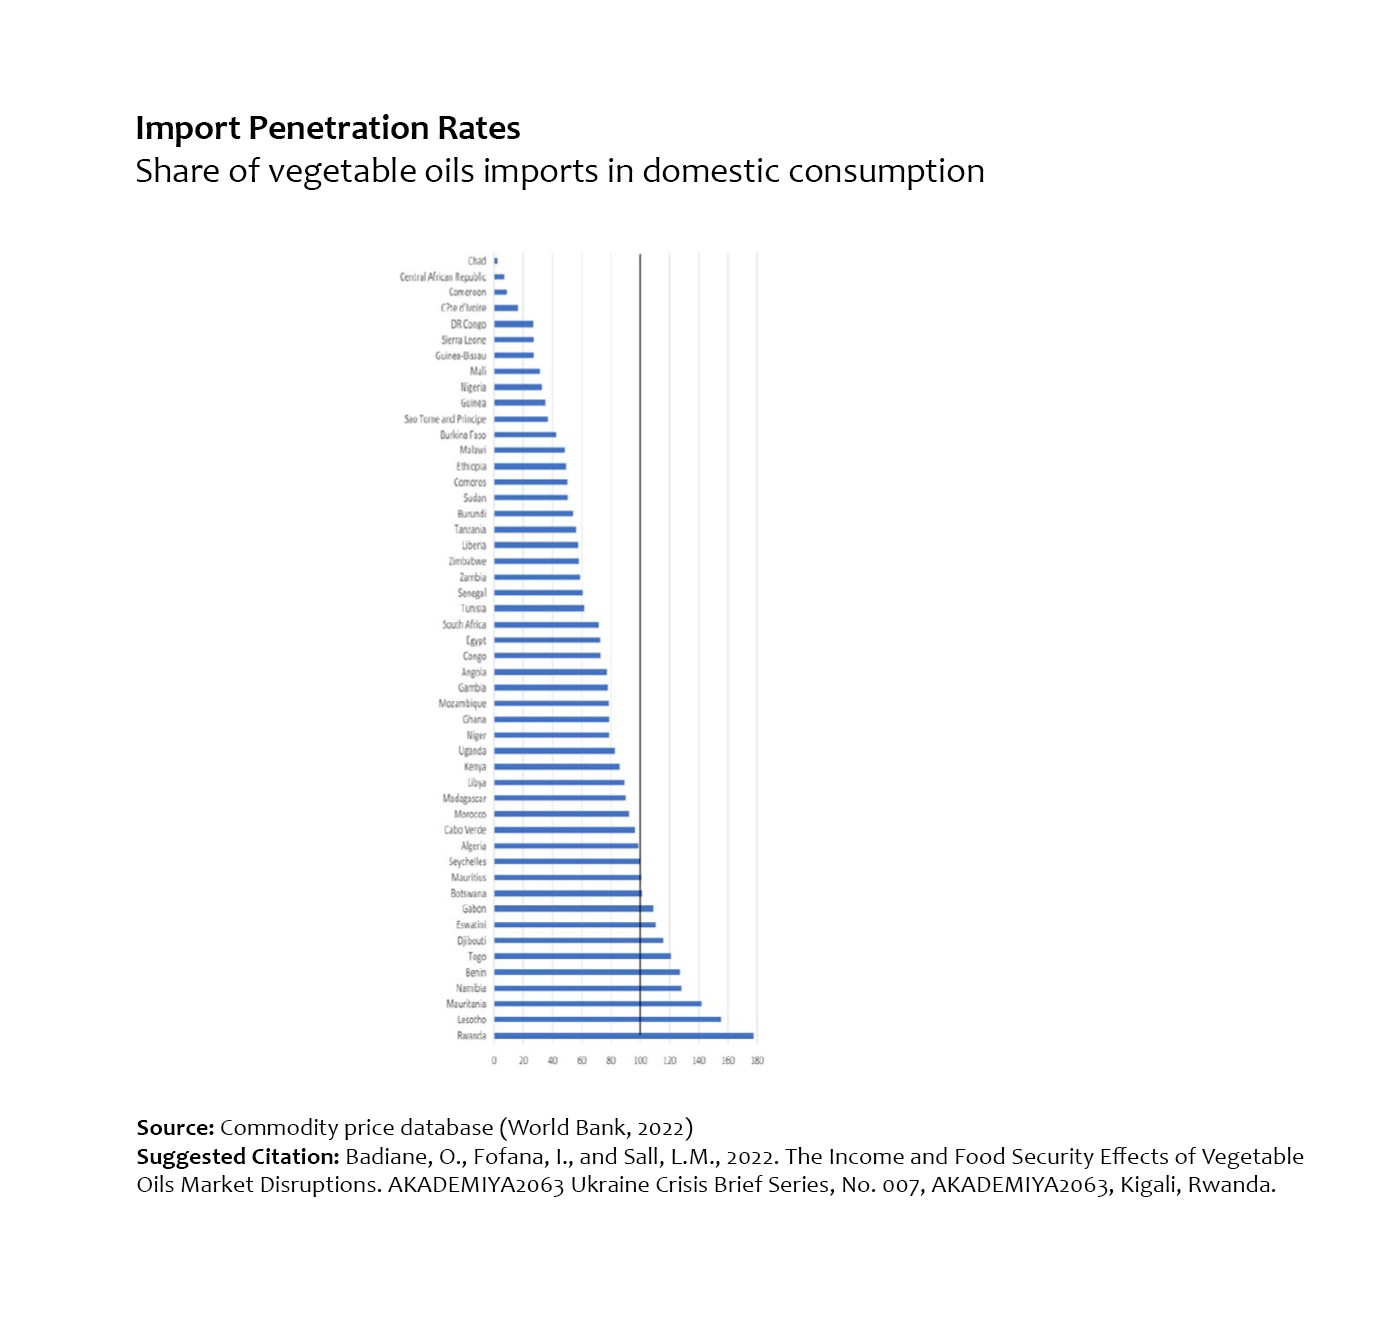
Import Penetration Rates - Share of vegetable oils imports in domestic consumption
Changes in Gross Income vs Baseline (%) - Rural Farm Households (Ghana)
 - Rural Farm Households (Ghana).jpg)
Changes in Gross Income vs Baseline (%) - Rural Farm Households (Ghana)
Changes in Gross Income vs Baseline (%) - Rural Non-farm Households (Ghana)
 - Rural Non-farm Households (Ghana).jpg)
Changes in Gross Income vs Baseline (%) - Rural Non-farm Households (Ghana)
Changes in Gross Income vs Baseline (%) - Urban Households (Ghana)
 - Urban Households (Ghana).jpg)
Changes in Gross Income vs Baseline (%) - Urban Households (Ghana)
Changes in Gross Income vs Baseline (%) - Rural Farm Households (Malawi)
 - Rural Farm Households (Malawi).jpg)
Changes in Gross Income vs Baseline (%) - Rural Farm Households (Malawi)
Changes in Gross Income vs Baseline (%) - Rural Non-farm Households (Malawi)
 - Rural Non-farm Households (Malawi).jpg)
Changes in Gross Income vs Baseline (%) - Rural Non-farm Households (Malawi)
Changes in Gross Income vs Baseline (%) - Urban Households (Malawi)
 - Urban Households (Malawi).jpg)
Changes in Gross Income vs Baseline (%) - Urban Households (Malawi)
Changes in Gross Income vs Baseline (%) - Rural Farm Households (Mozambique)
 - Rural Farm Households (Mozambique).jpg)
Changes in Gross Income vs Baseline (%) - Rural Farm Households (Mozambique)
Changes in Gross Income vs Baseline (%) - Rural Non-farm Households (Mozambique)
 - Rural Non-farm Households (Mozambique).jpg)
Changes in Gross Income vs Baseline (%) - Rural Non-farm Households (Mozambique)
Changes in Gross Income vs Baseline (%) - Urban Households (Mozambique)
 - Urban Households (Mozambique).jpg)
Changes in Gross Income vs Baseline (%) - Urban Households (Mozambique)
Changes in Gross Income vs Baseline (%) - Rural Farm Households (Uganda)
 - Rural Farm Households (Uganda).jpg)
Changes in Gross Income vs Baseline (%) - Rural Farm Households (Uganda)
Changes in Gross Income vs Baseline (%) - Rural Non-farm Households (Uganda)
 - Rural Non-farm Households (Uganda).jpg)
Changes in Gross Income vs Baseline (%) - Rural Non-farm Households (Uganda)
Changes in Gross Income vs Baseline (%) - Urban Households (Uganda)
 - Urban Households (Uganda).jpg)
Changes in Gross Income vs Baseline (%) - Urban Households (Uganda)
Changes in Food Price Index vs Baseline (%) - Rural Farm Households (Ghana)
 - Rural Farm Households (Ghana).jpg)
Changes in Food Price Index vs Baseline (%) - Rural Farm Households (Ghana)
Changes in Food Price Index vs Baseline (%) - Rural Non-farm Households (Ghana)
 - Rural Non-farm Households (Ghana).jpg)
Changes in Food Price Index vs Baseline (%) - Rural Non-farm Households (Ghana)
Changes in Food Price Index vs Baseline (%) - Urban Households (Ghana)
 - Urban Households (Ghana).jpg)
Changes in Food Price Index vs Baseline (%) - Urban Households (Ghana)
Changes in Food Price Index vs Baseline (%) - Rural Farm Households (Malawi)
 - Rural Farm Households (Malawi).jpg)
Changes in Food Price Index vs Baseline (%) - Rural Farm Households (Malawi)
Changes in Food Price Index vs Baseline (%) - Rural Non-farm Households (Malawi)
 - Rural Non-farm Households (Malawi).jpg)
Changes in Food Price Index vs Baseline (%) - Rural Non-farm Households (Malawi)
Changes in Food Price Index vs Baseline (%) - Urban Households (Malawi)
 - Urban Households (Malawi).jpg)
Changes in Food Price Index vs Baseline (%) - Urban Households (Malawi)
Changes in Food Price Index vs Baseline (%) - Rural Farm Households (Mozambique)
 - Rural Farm Households (Mozambique).jpg)
Changes in Food Price Index vs Baseline (%) - Rural Farm Households (Mozambique)
Changes in Food Price Index vs Baseline (%) - Rural Non-farm Households (Mozambique)
 - Rural Non-farm Households (Mozambique).jpg)
Changes in Food Price Index vs Baseline (%) - Rural Non-farm Households (Mozambique)
Changes in Food Price Index vs Baseline (%) - Urban Households (Mozambique)
 - Urban Households (Mozambique).jpg)
Changes in Food Price Index vs Baseline (%) - Urban Households (Mozambique)
Changes in Food Price Index vs Baseline (%) - Rural Farm Households (Uganda)
 - Rural Farm Households (Uganda).jpg)
Changes in Food Price Index vs Baseline (%) - Rural Farm Households (Uganda)
Changes in Food Price Index vs Baseline (%) - Rural Non-farm Households (Uganda)
 - Rural Non-farm Households (Uganda).jpg)
Changes in Food Price Index vs Baseline (%) - Rural Non-farm Households (Uganda)
Changes in Food Price Index vs Baseline (%) - Urban Households (Uganda)
 - Urban Households (Uganda).jpg)
Changes in Food Price Index vs Baseline (%) - Urban Households (Uganda)
Changes in Food Consumption vs Baseline (%) - Rural Farm Households (Ghana)
 - Rural Farm Households (Ghana).jpg)
Changes in Food Consumption vs Baseline (%) - Rural Farm Households (Ghana)
Changes in Food Consumption vs Baseline (%) - Rural Non-farm Households (Ghana)
 - Rural Non-farm Households (Ghana).jpg)
Changes in Food Consumption vs Baseline (%) - Rural Non-farm Households (Ghana)
Changes in Food Consumption vs Baseline (%) - Urban Households (Ghana)
 - Urban Households (Ghana).jpg)
Changes in Food Consumption vs Baseline (%) - Urban Households (Ghana)
Changes in Food Consumption vs Baseline (%) - Rural Farm Households (Malawi)
 - Rural Farm Households (Malawi).jpg)
Changes in Food Consumption vs Baseline (%) - Rural Farm Households (Malawi)
Changes in Food Consumption vs Baseline (%) - Rural Non-farm Households (Malawi)
 - Rural Non-farm Households (Malawi).jpg)
Changes in Food Consumption vs Baseline (%) - Rural Non-farm Households (Malawi)
Changes in Food Consumption vs Baseline (%) - Urban Households (Malawi)
 - Urban Households (Malawi).jpg)
Changes in Food Consumption vs Baseline (%) - Urban Households (Malawi)
Changes in Food Consumption vs Baseline (%) - Rural Farm Households (Mozambique)
 - Rural Farm Households (Mozambique).jpg)
Changes in Food Consumption vs Baseline (%) - Rural Farm Households (Mozambique)
Changes in Food Consumption vs Baseline (%) - Rural Non-farm Households (Mozambique)
 - Rural Non-farm Households (Mozambique).jpg)
Changes in Food Consumption vs Baseline (%) - Rural Non-farm Households (Mozambique)
Changes in Food Consumption vs Baseline (%) - Urban Households (Malawi)
 - Urban Households (Mozambique).jpg)
Changes in Food Consumption vs Baseline (%) - Urban Households (Mozambique)
Changes in Food Consumption vs Baseline (%) - Rural Farm Households (Uganda)
 - Rural Farm Households (Uganda).jpg)
Changes in Food Consumption vs Baseline (%) - Rural Farm Households (Uganda)
Changes in Food Consumption vs Baseline (%) - Rural Non-farm Households (Uganda)
 - Rural Non-farm Households (Uganda).jpg)
Changes in Food Consumption vs Baseline (%) - Rural Non-farm Households (Uganda)
Changes in Food Consumption vs Baseline (%) - Urban Households (Uganda)
Changes in Food Consumption vs Baseline (%) - Urban Households (Uganda)
Production and Consumption of Fertilizer in Africa - Producers in thousand tonnes (2019)
.jpg)
Production and Consumption of Fertilizer in Africa - Producers in thousand tonnes (2019)
Production and Consumption of Fertilizer in Africa - Top 10 consumers in kg/ha (2018)
.jpg)
Production and Consumption of Fertilizer in Africa - Top 10 consumers in kg/ha (2018)
Fertilizer Consumption in Kilogram per Hectare (Kg/Ha) of Cultivated Land in 2018
 of Cultivated Land in 2018.jpg)
Fertilizer Consumption in Kilogram per Hectare (Kg/Ha) of Cultivated Land in 2018
Monthly Price Indices of Fertilizer from January 2019 to March 2022 (nominal US dollars,
2010=100)
.jpg)
Monthly Price Indices of Fertilizer from January 2019 to March 2022 (nominal US dollars, 2010=100)
Monthly Price Indices of Fertilizer from January 2000 to March 2022 (nominal US dollars,
2010=100)
.jpg)
Monthly Price Indices of Fertilizer from January 2000 to March 2022 (nominal US dollars, 2010=100)
Dependency on Fertilizer Imports from Ukraine and Russia (share of in-country imports)
.jpg)
Dependency on Fertilizer Imports from Ukraine and Russia (share of in-country imports)
Fertilizer Import Penetration, Average 2015-2019 (Imports/Domestic Consumption)
.jpg)
Fertilizer Import Penetration, Average 2015-2019 (Imports/Domestic Consumption)
Top 10 Countries involved in Fertilizer Re-exportation within Africa in 2020 (Million
USD)
.jpg)
Top 10 Countries involved in Fertilizer Re-exportation within Africa in 2020 (Million USD)
Intra-regional Fertilizer Re-export Flows in 2020 (Million USD)
.jpg)
Intra-regional Fertilizer Re-export Flows in 2020 (Million USD)
Domestic and International Wheat Prices (Jan-May 2022)
.jpg)
Domestic and International Wheat Prices (Jan-May 2022)
Maize Prices in Urban and Rural Markets, (Jan-May 2022)
.jpg)
Maize Prices in Urban and Rural Markets, (Jan-May 2022)
Sugar prices in Malawi’s Urban and Rural Markets, (Jan-May 2022)
.jpg)
Sugar prices in Malawi’s Urban and Rural Markets, (Jan-May 2022)
Rice and Millet Prices across Urban and Rural Markets, (Jan-May 2022)
.jpg)
Rice and Millet Prices across Urban and Rural Markets, (Jan-May 2022)
Cooking Oil Prices across Urban and Rural Markets, (Jan-May 2022)
.jpg)
Cooking Oil Prices across Urban and Rural Markets, (Jan-May 2022)
Energy Price Trends in Malawi during the Russia-Ukraine Crisis (Jan-May 2022)
.jpg)
Energy Price Trends in Malawi during the Russia-Ukraine Crisis (Jan-May 2022)
Price Changes in Rural and Urban Markets (Jan-May 2022)
.jpg)
Price Changes in Rural and Urban Markets (Jan-May 2022)
Changes in Gross Income vs Baseline (%)
.jpg)
Changes in Gross Income vs Baseline (%)
Comparison Of Wheat Production in South Africa, 2021 and 2022
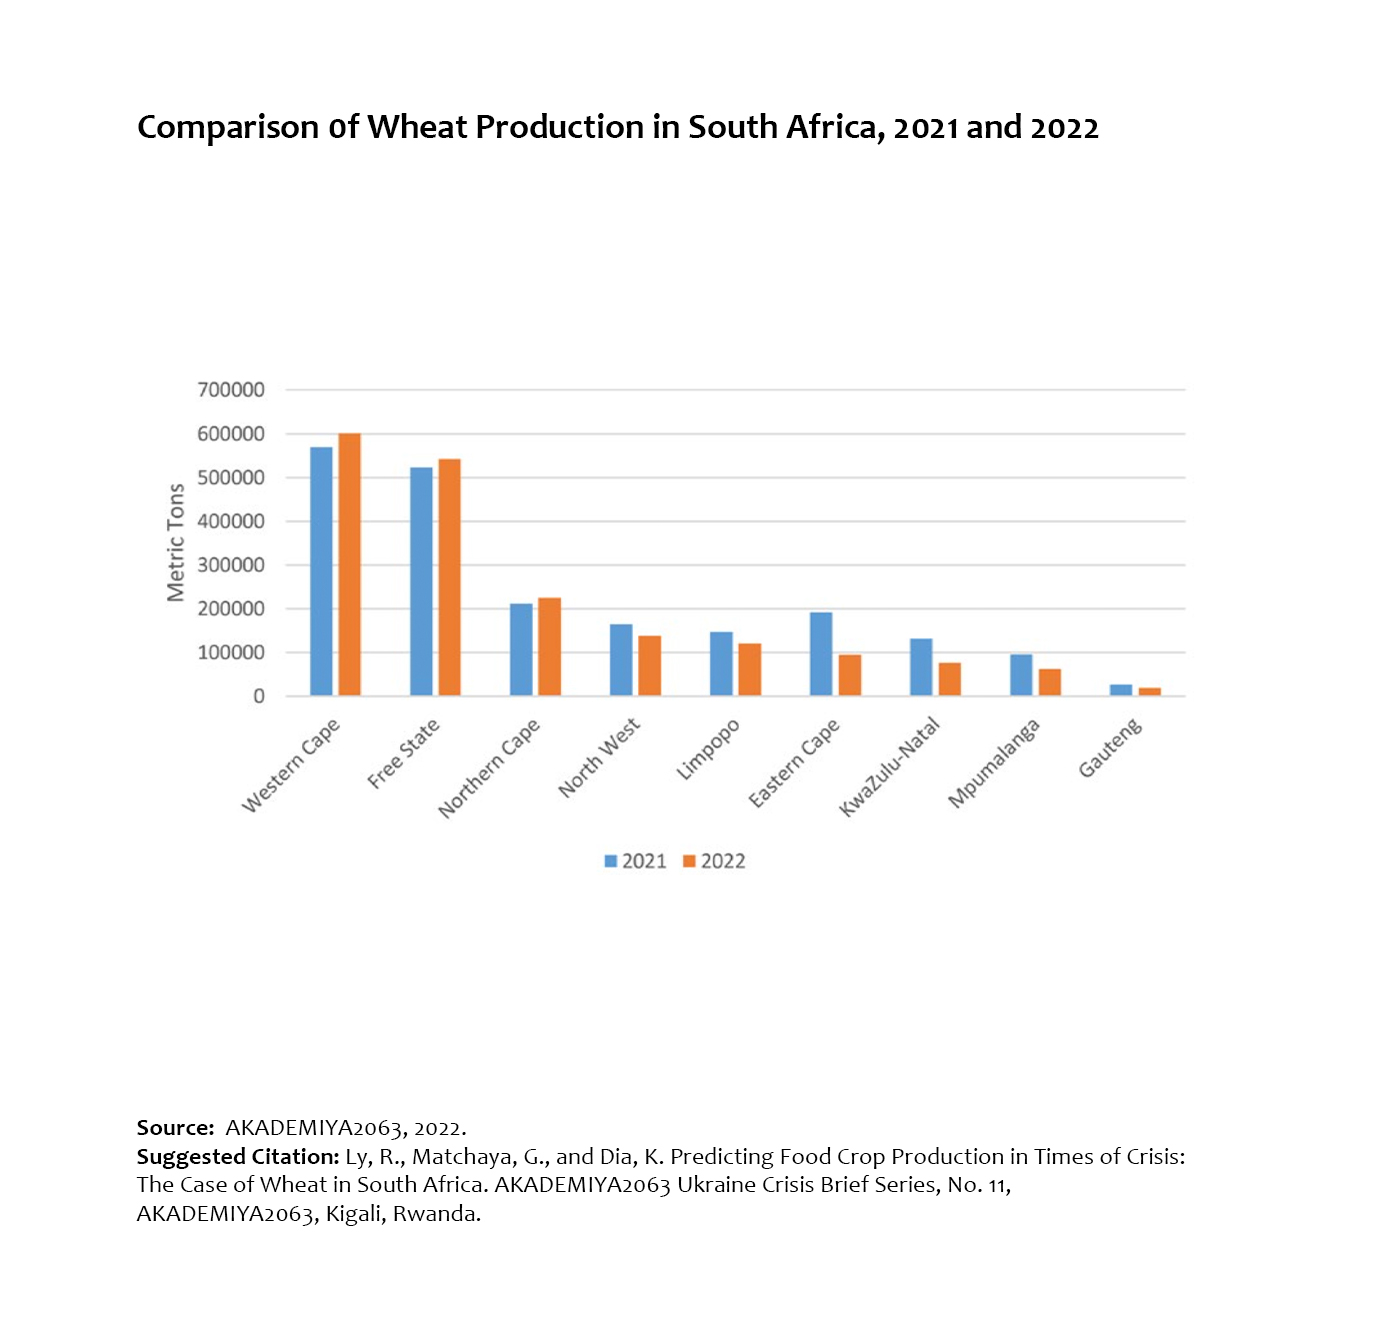
Comparison Of Wheat Production in South Africa, 2021 and 2022
Rainfall Anomalies and Predicted Wheat Production in South Africa for 2022
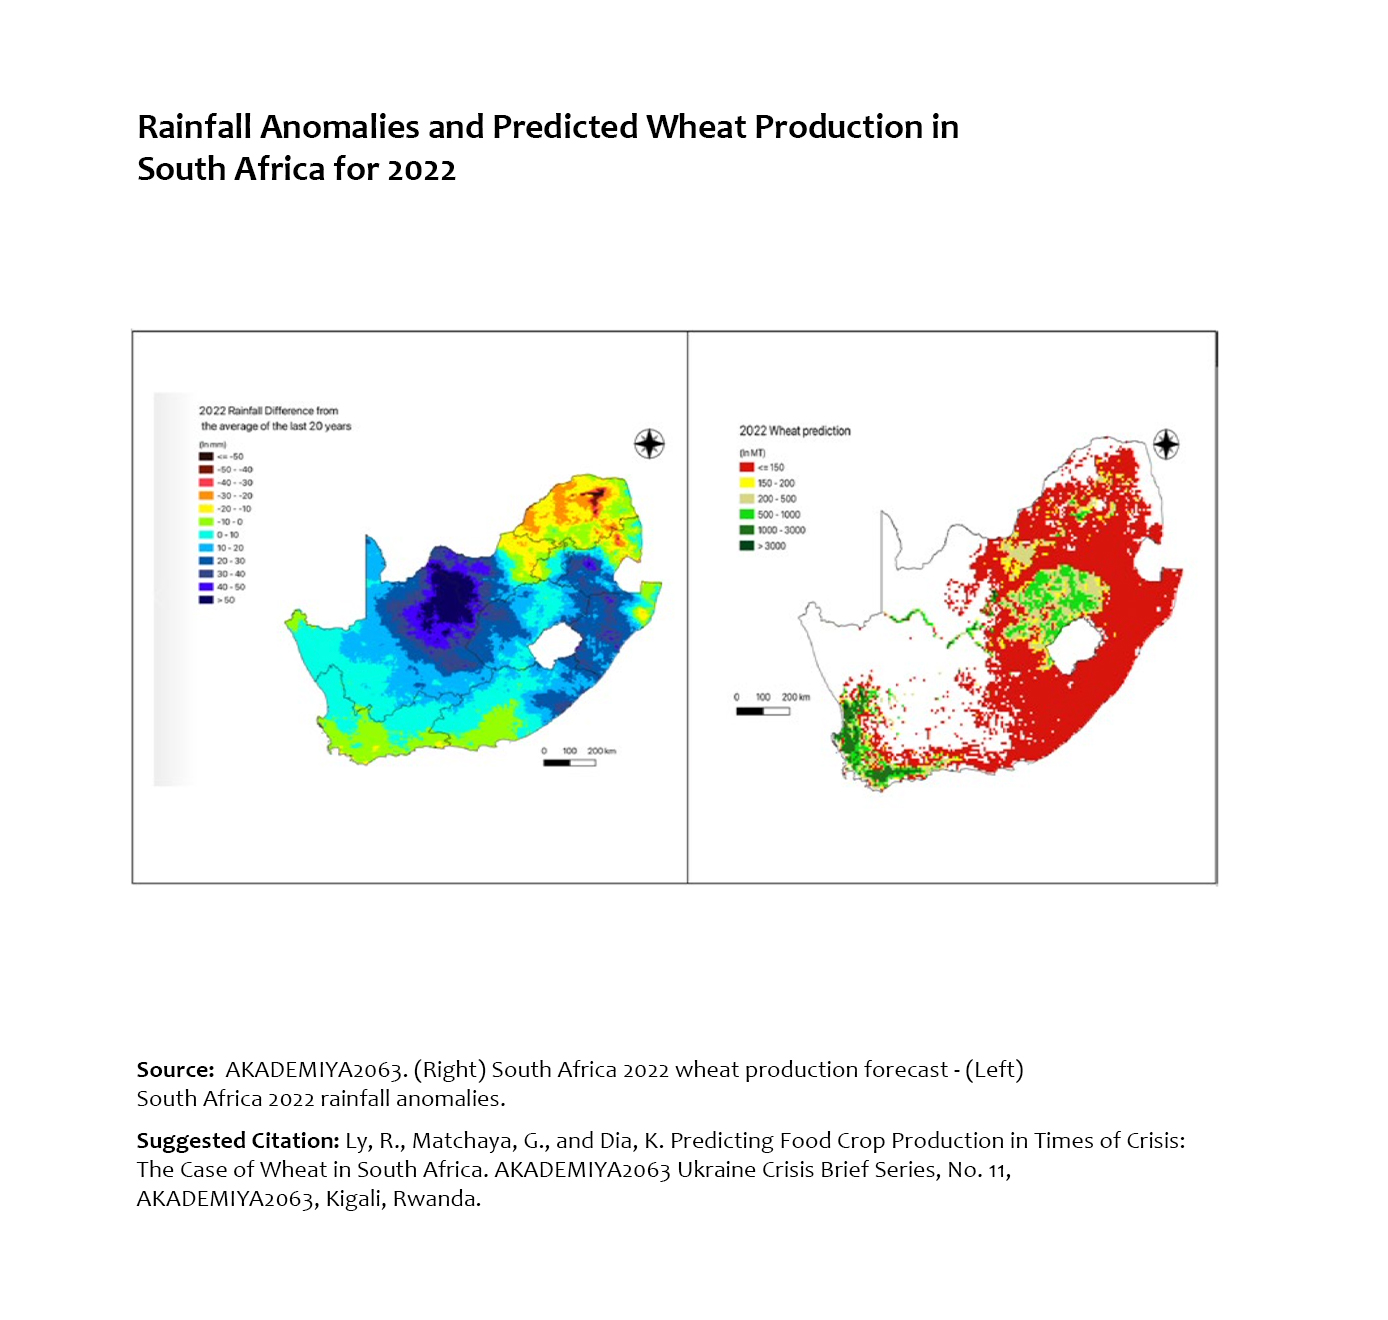
Rainfall Anomalies and Predicted Wheat Production in South Africa for 2022
Temperature Anomalies and Predicted Wheat Production in South Africa for 2022
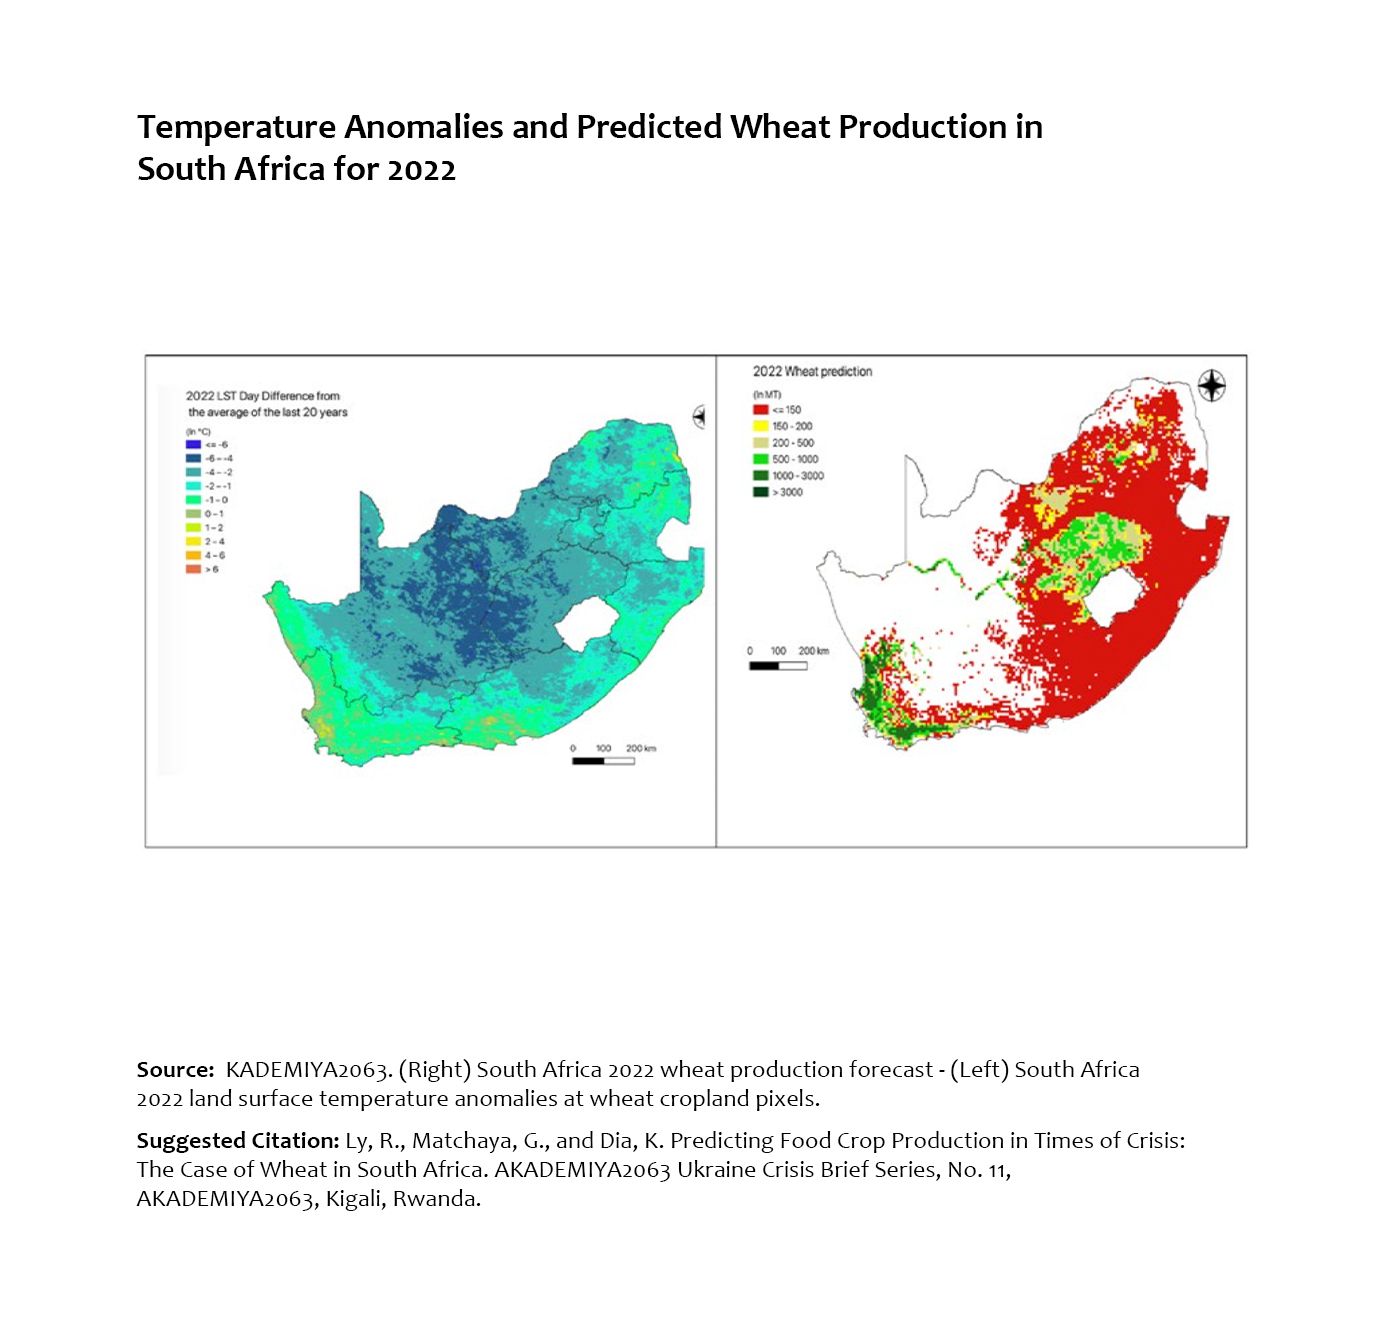
Temperature Anomalies and Predicted Wheat Production in South Africa for 2022
NDVI Anomalies and Predicted Wheat Production in South Africa for 2022
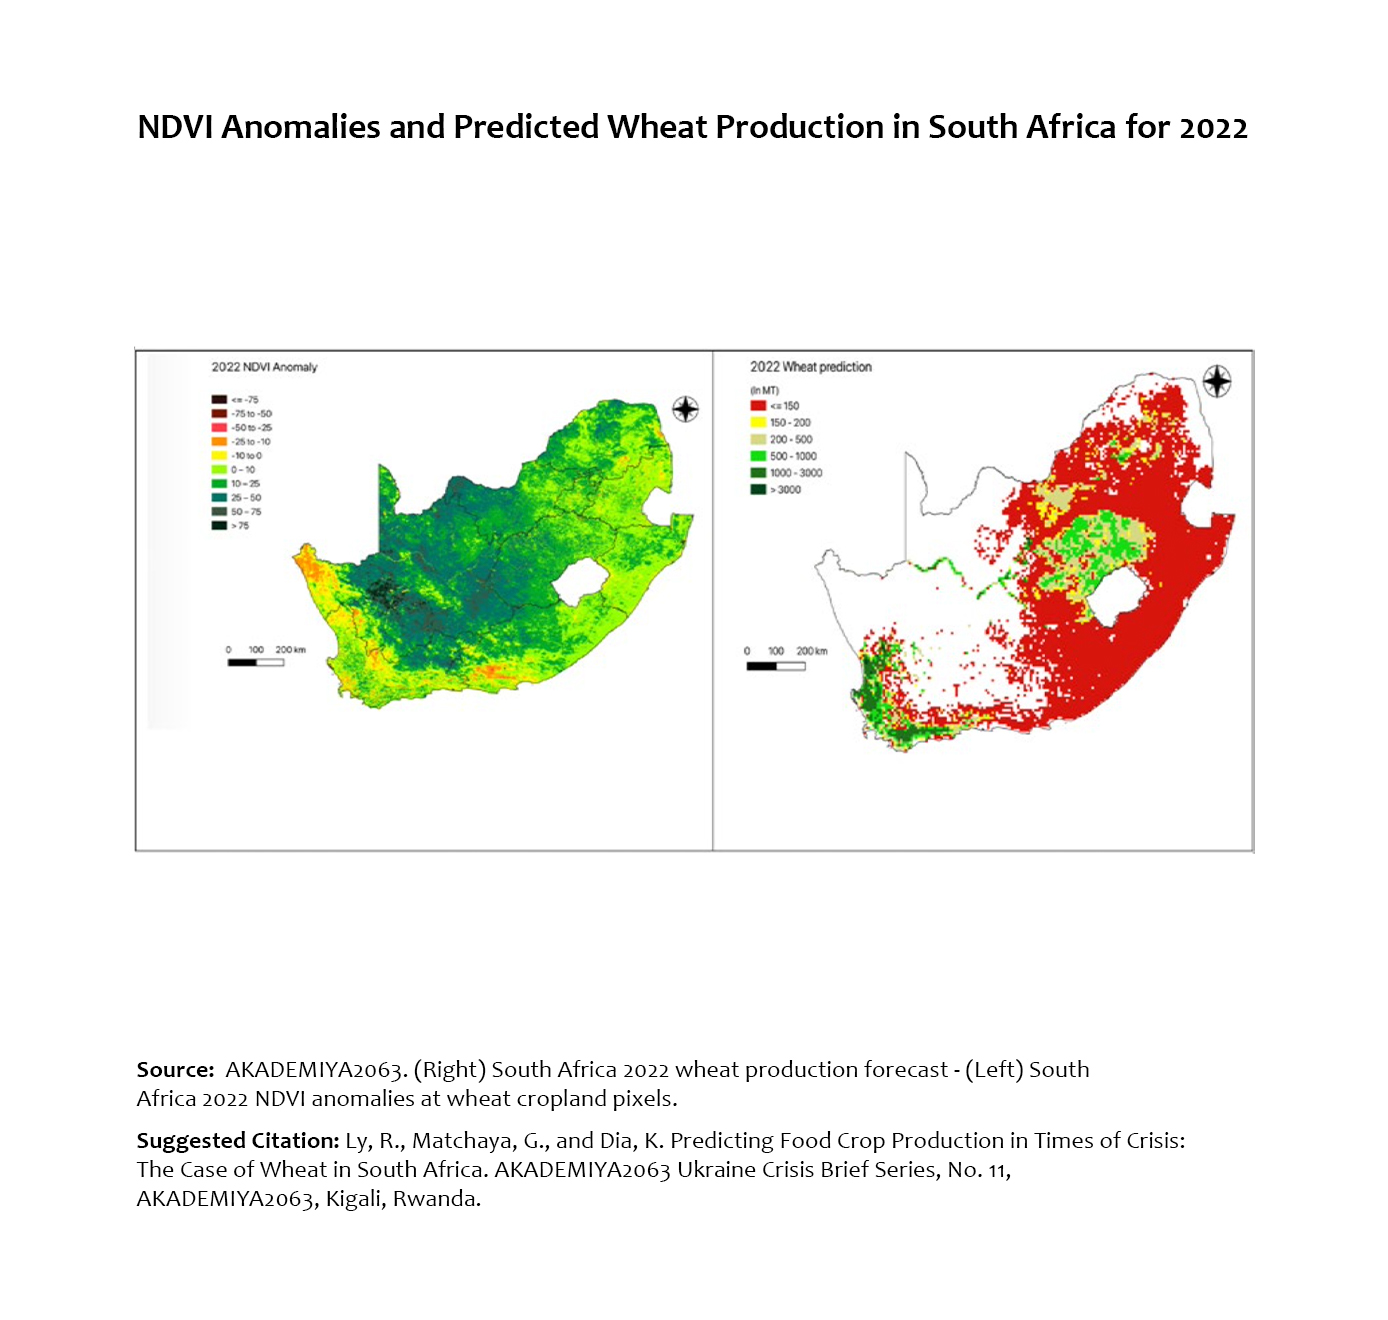
NDVI Anomalies and Predicted Wheat Production in South Africa for 2022
Weekly Prices of Food Commodities for Nyabugogo Market in Kigali, (Jan-May 2022)
.jpg)
Weekly Prices of Food Commodities for Nyabugogo Market in Kigali, (Jan-May 2022)
Weekly Prices of Food Commodities for Musanze Market, (Jan-May 2022)
.jpg)
Weekly Prices of Food Commodities for Musanze Market, (Jan-May 2022)
Weekly Prices of Food Commodities in Nyakarambi Market, Kirehe District, (Jan-May 2022)
.jpg)
Weekly Prices of Food Commodities in Nyakarambi Market, Kirehe District, (Jan-May 2022)
Weekly prices of Food Commodities for Gasarenda Market, Nyamagabe District, (Jan-May
2022)
.jpg)
Weekly prices of Food Commodities for Gasarenda Market, Nyamagabe District, (Jan-May 2022)
Weekly Energy Prices for Kigali City, (Jan-May 2022)
.jpg)
Weekly Energy Prices for Kigali City, (Jan-May 2022)
Wheat Production in Kenya (2016-2020)
.jpg)
Wheat Production in Kenya (2016-2020)
Kenya Wheat Production Forecast for 2022
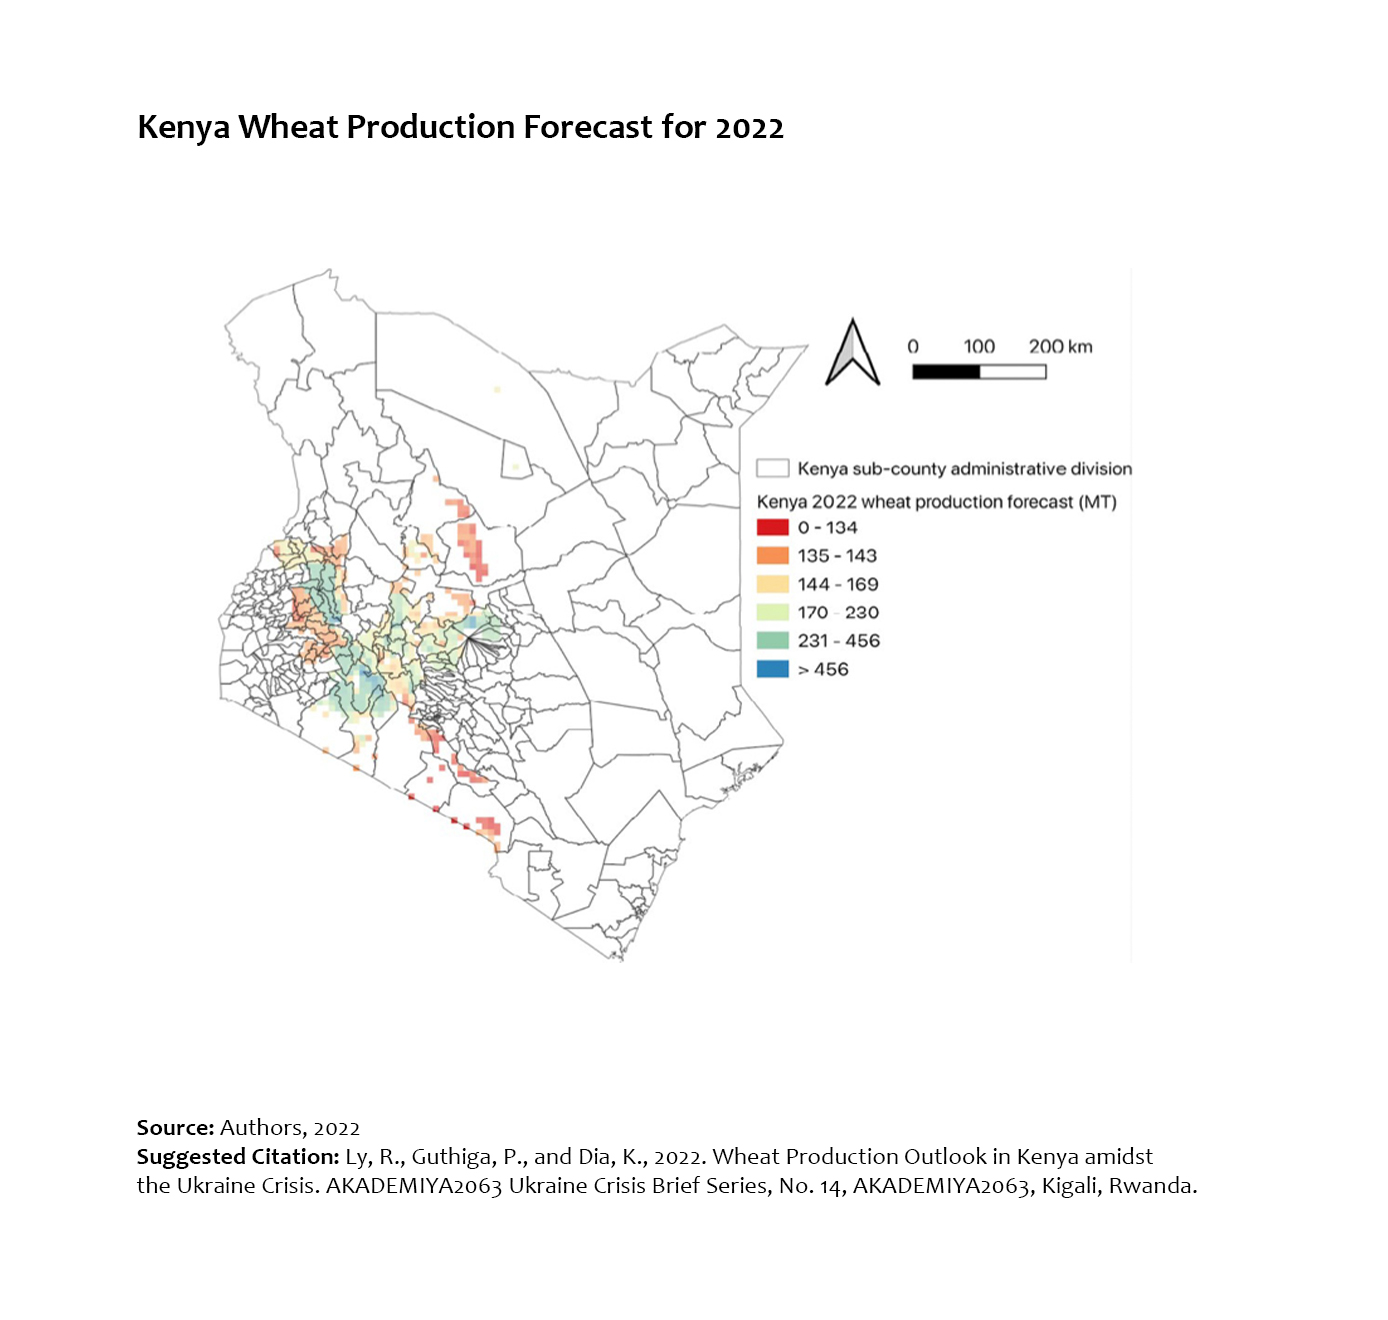
Kenya Wheat Production Forecast for 2022
Comparison between 2022 and 2021 Wheat Production in Kenya
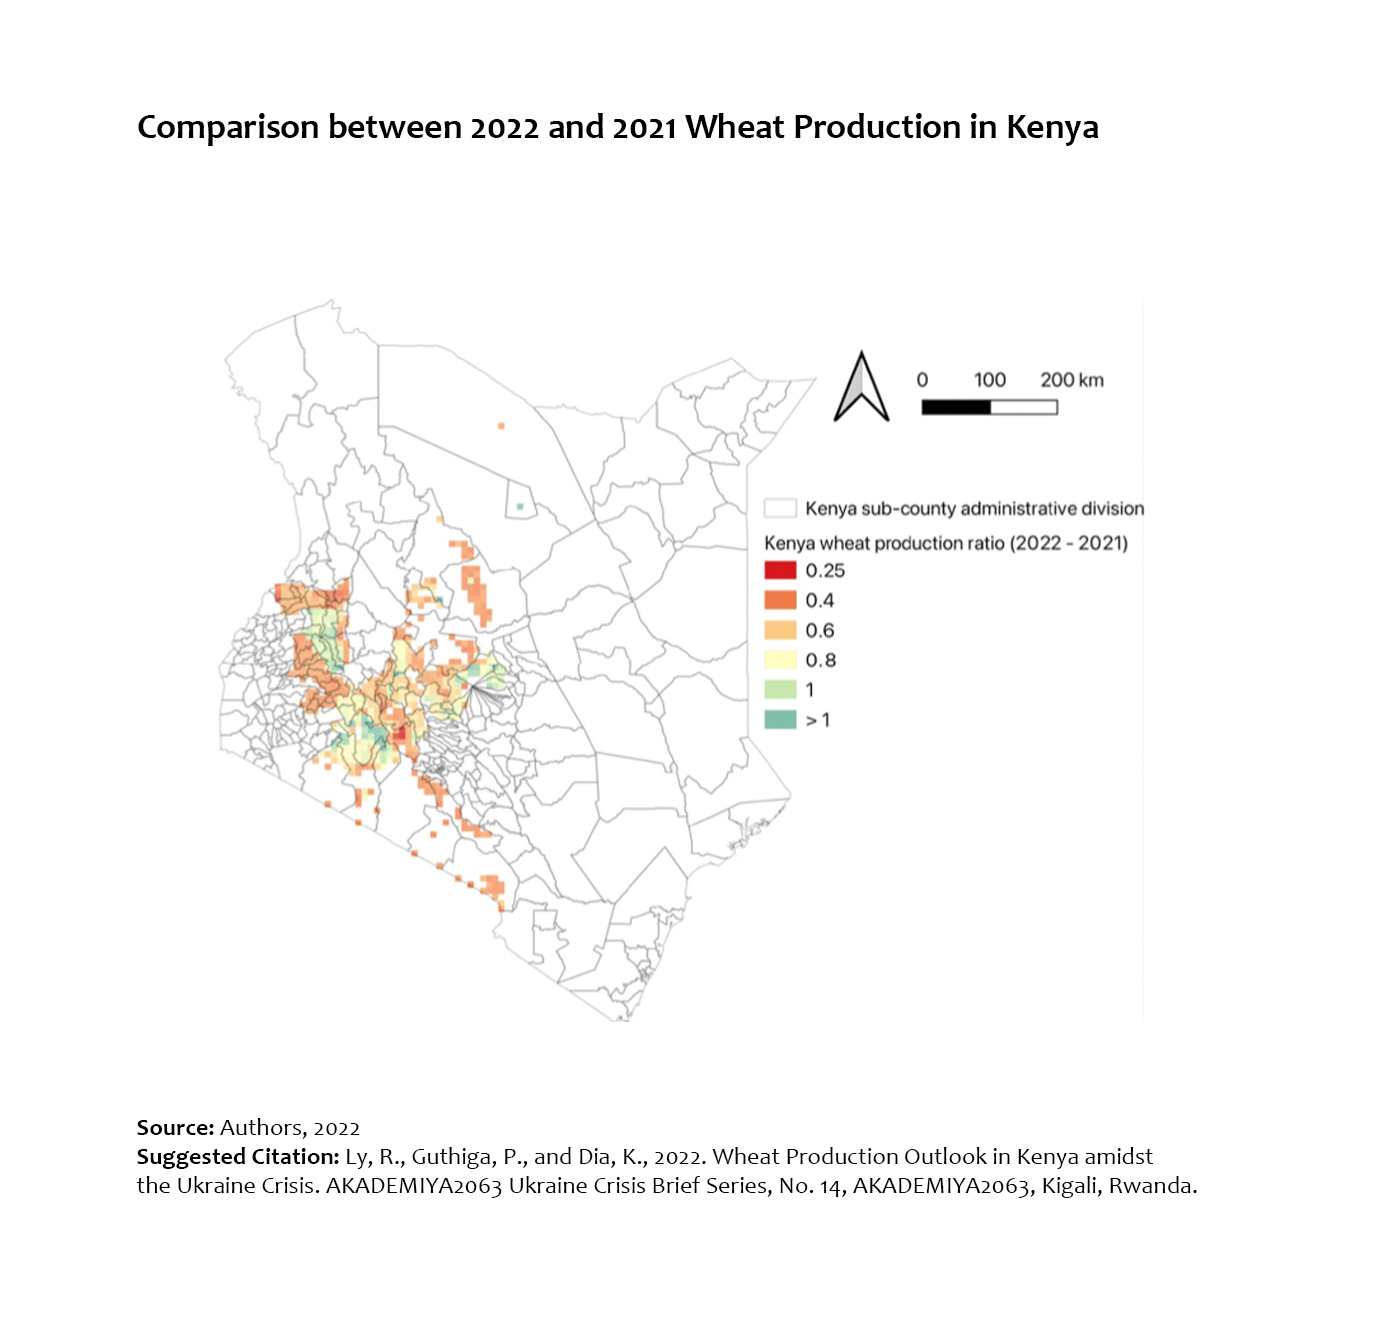
Comparison between 2022 and 2021 Wheat Production in Kenya
Kenya 2022 Wheat Production Forecast (left); Kenya 2022 Land Surface Temperature
Anomalies (right)
 - Kenya 2022 Land Surface Temperature Anomalies (right).jpg)
Kenya 2022 Wheat Production Forecast (left); Kenya 2022 Land Surface Temperature Anomalies (right)
Kenya 2022 Wheat Production Forecast (left); Kenya 2022 Rainfall Anomalies (right)
 - Kenya 2022 Rainfall Anomalies (right).jpg)
Kenya 2022 Wheat Production Forecast (left); Kenya 2022 Rainfall Anomalies (right)
Kenya 2022 Land Surface Temperature, Rainfall, and Normalized Difference Vegetation
Index Anomalies
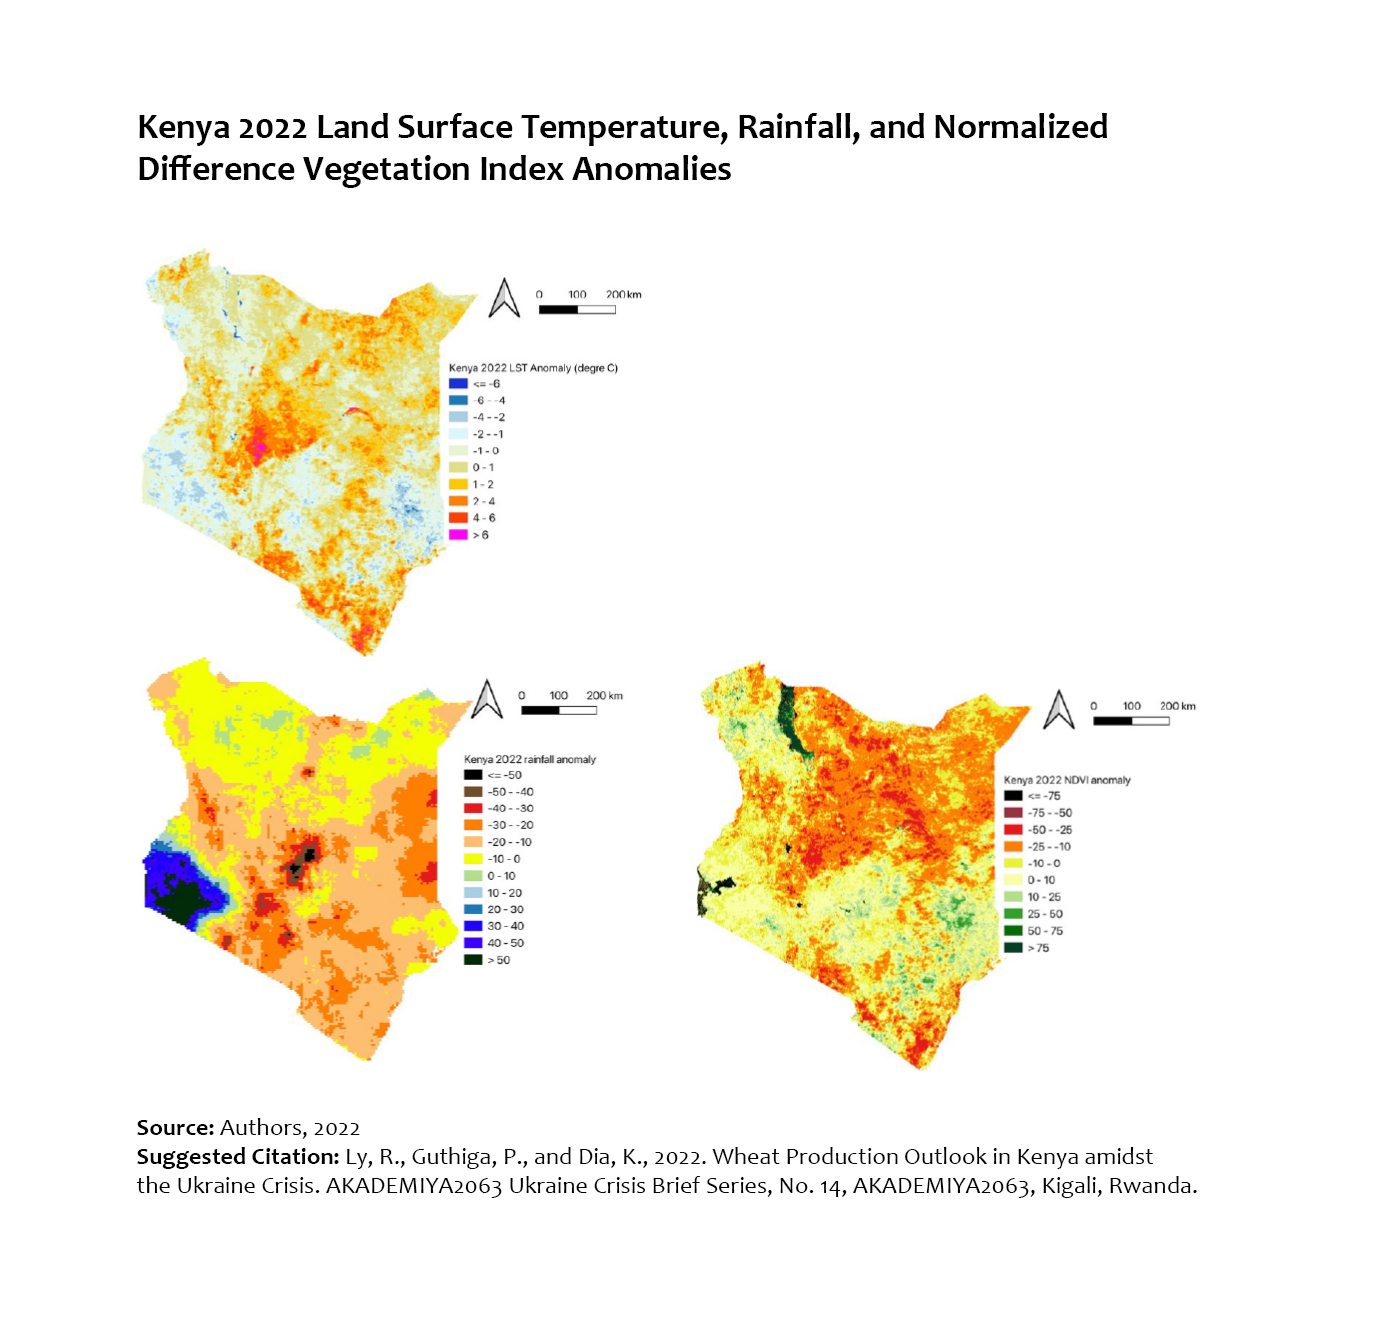
Kenya 2022 Land Surface Temperature, Rainfall, and Normalized Difference Vegetation Index Anomalies
Wheat Prices in Urban and Rural Markets, (Jan-May 2022)
.jpg)
Wheat Prices in Urban and Rural Markets, (Jan-May 2022)
Sugar Prices in Urban and Rural Markets of Mozambique, (Jan-May 2022)
.jpg)
Sugar Prices in Urban and Rural Markets of Mozambique, (Jan-May 2022)
Rice Prices across Urban and Rural Markets, (Jan-May 2022)
.jpg)
Rice Prices across Urban and Rural Markets, (Jan-May 2022)
Red Meat Prices across Urban and Rural Markets, (Jan-May 2022)
.jpg)
Red Meat Prices across Urban and Rural Markets, (Jan-May 2022)
Cooking Oil Prices across Urban and Rural Markets, (Jan-May 2022)
.jpg)
Cooking Oil Prices across Urban and Rural Markets, (Jan-May 2022)
Petrol, Gas and Diesel Prices across Urban and Rural Markets, (Jan-May 2022)
.jpg)
Petrol, Gas and Diesel Prices across Urban and Rural Markets, (Jan-May 2022)
Changes in Prices for all Commodities in Rural and Urban Markets, (Jan-May 2022)
.jpg)
Changes in Prices for all Commodities in Rural and Urban Markets, (Jan-May 2022)
Zimbabwe Wheat Imports (2019)
.jpg)
Zimbabwe Wheat Imports (2019)
Wheat Prices in Urban and Rural Markets, (Jan-May 2022)
.jpg)
Wheat Prices in Urban and Rural Markets, (Jan-May 2022)
Sugar Prices in Urban and Rural markets of Zimbabwe, (Jan-May 2022)
.jpg)
Sugar Prices in Urban and Rural markets of Zimbabwe, (Jan-May 2022)
Rice and Maize Prices across Urban and Rural Markets, (Jan-May 2022)
.jpg)
Rice and Maize Prices across Urban and Rural Markets, (Jan-May 2022)
Red Meat Prices across Urban and Rural Markets, (Jan-May 2022)
.jpg)
Red Meat Prices across Urban and Rural Markets, (Jan-May 2022)
Energy and Cooking Oil Prices across Urban and Rural Markets, (Jan-May 2022)
.jpg)
Energy and Cooking Oil Prices across Urban and Rural Markets, (Jan-May 2022)
Energy Prices across Urban and Rural Markets, (Jan-May 2022)
.jpg)
Energy Prices across Urban and Rural Markets, (Jan-May 2022)
Price Changes in Rural and Urban Markets
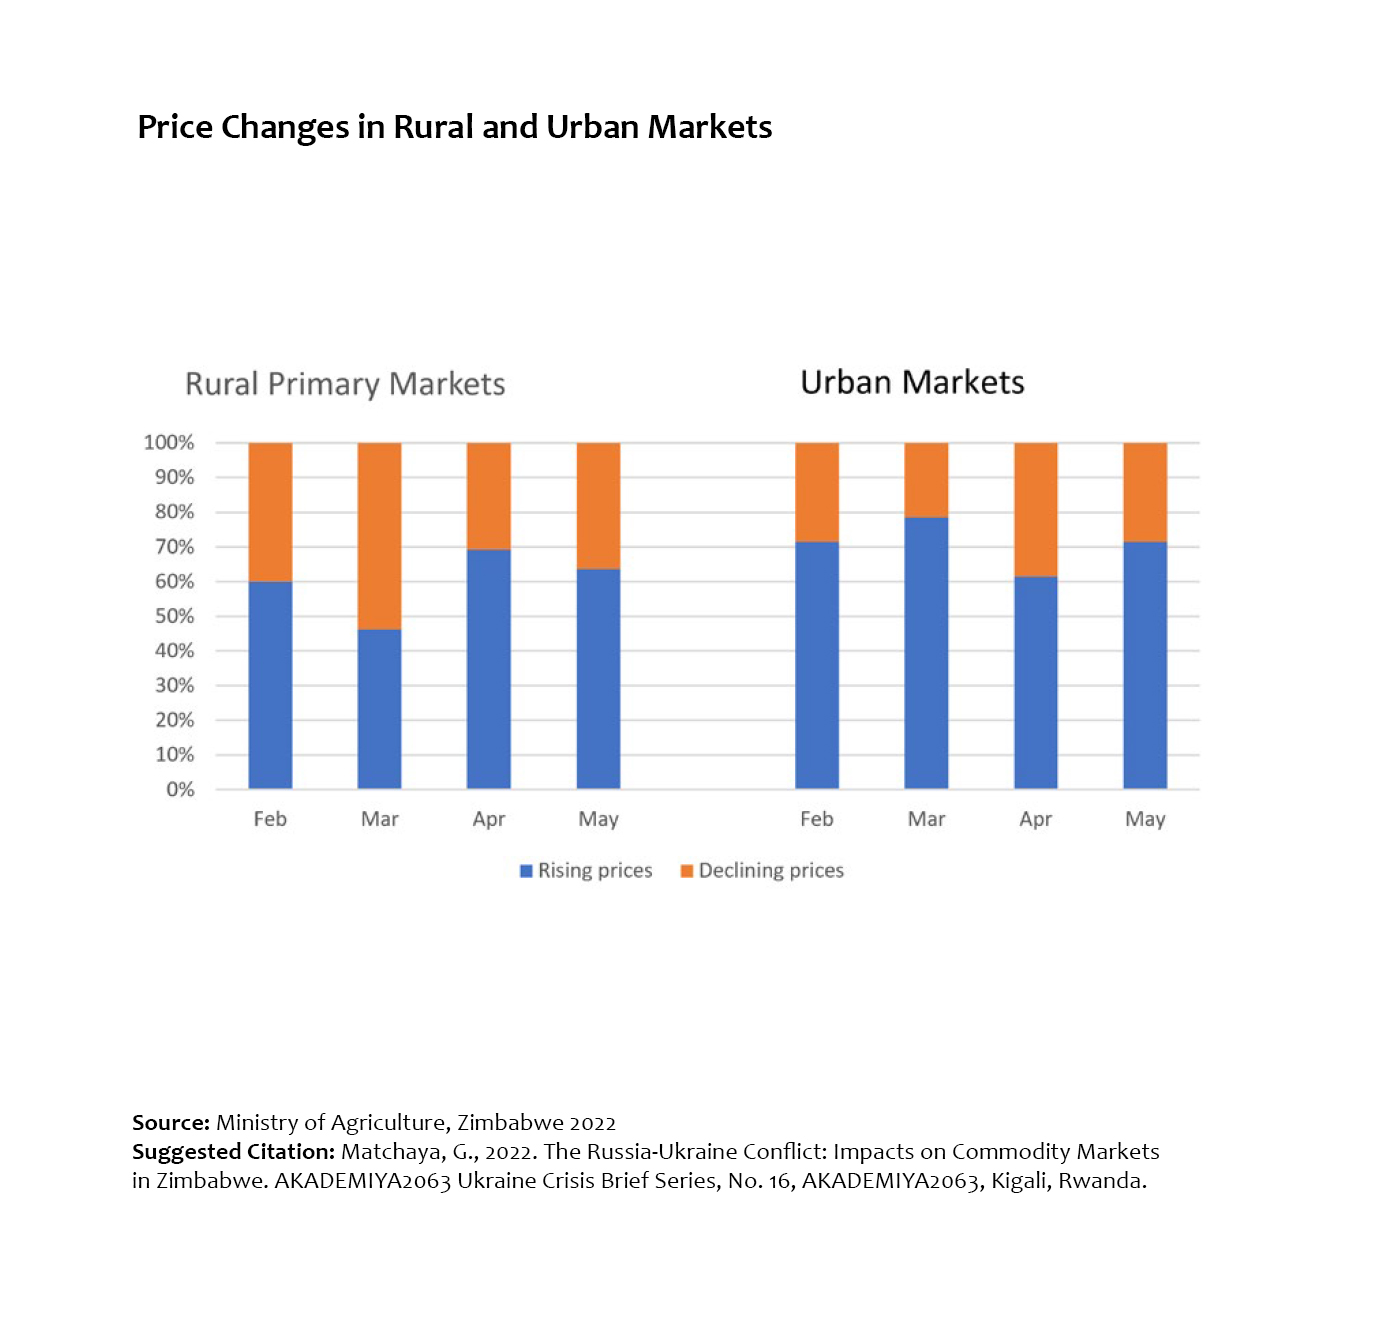
Price Changes in Rural and Urban Markets
Comparison 0f wheat production in Mozambique, 2021 and 2022
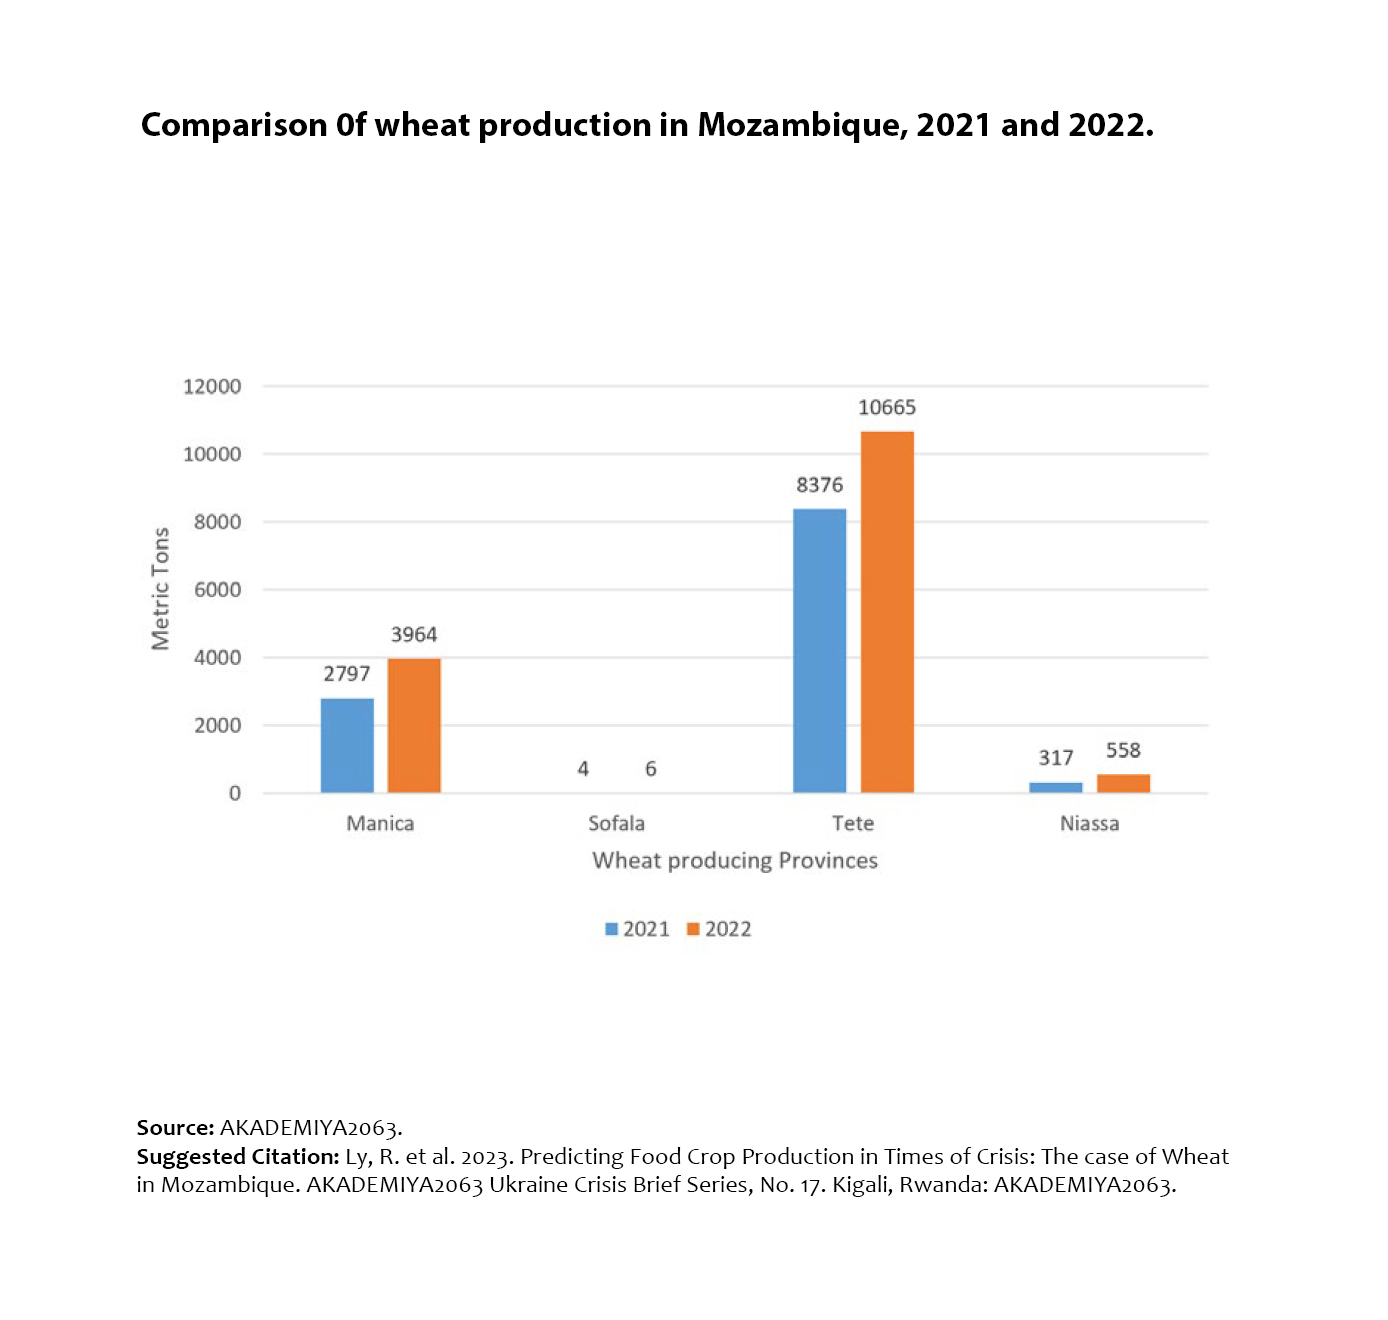
Comparison 0f wheat production in Mozambique, 2021 and 2022
Fertilizer Use by Type of Crop in Uganda, Percentage Changes

Fertilizer Use by Type of Crop in Uganda, Percentage Changes
Fertilizer Use Share by Crop Type, Uganda
Fertilizer Use Share by Crop Type, Uganda
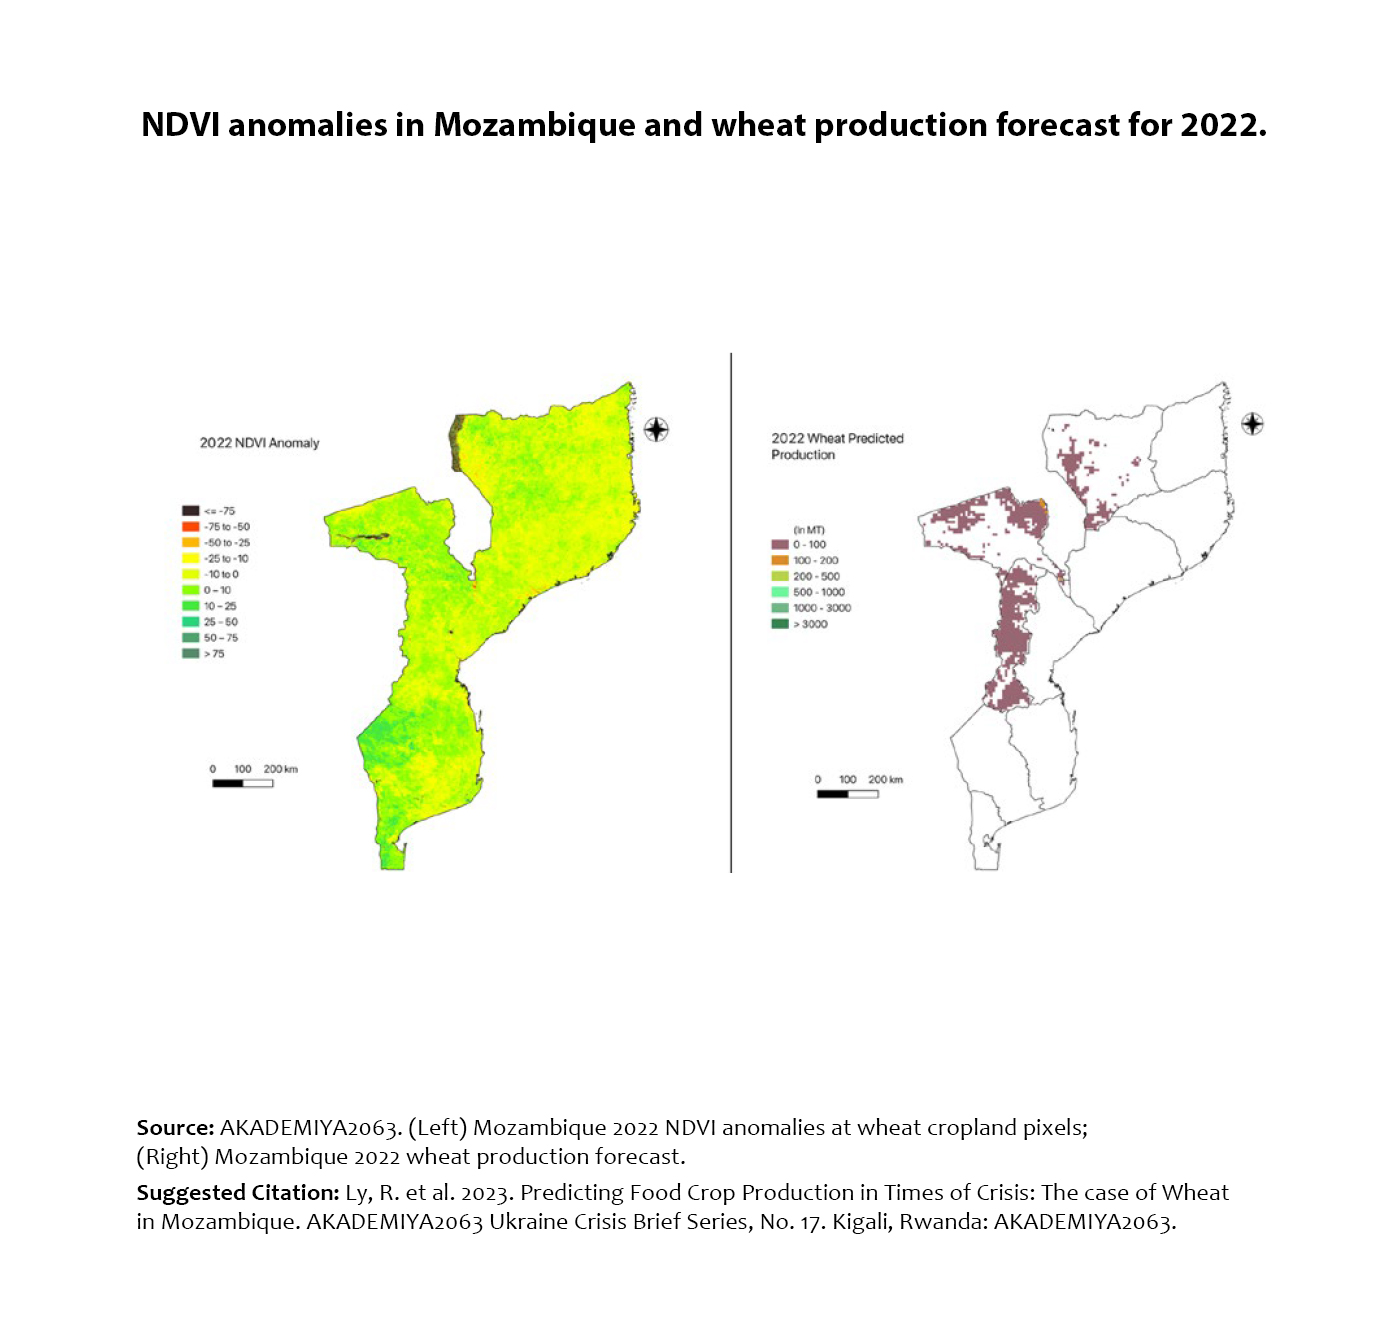
NDVI anomalies in Mozambique and wheat production forecast for 2022
NDVI anomalies in Mozambique and wheat production forecast for 2022
Output Effects in Uganda, Percentage Changes Ukraine
Output Effects in Uganda, Percentage Changes Ukraine
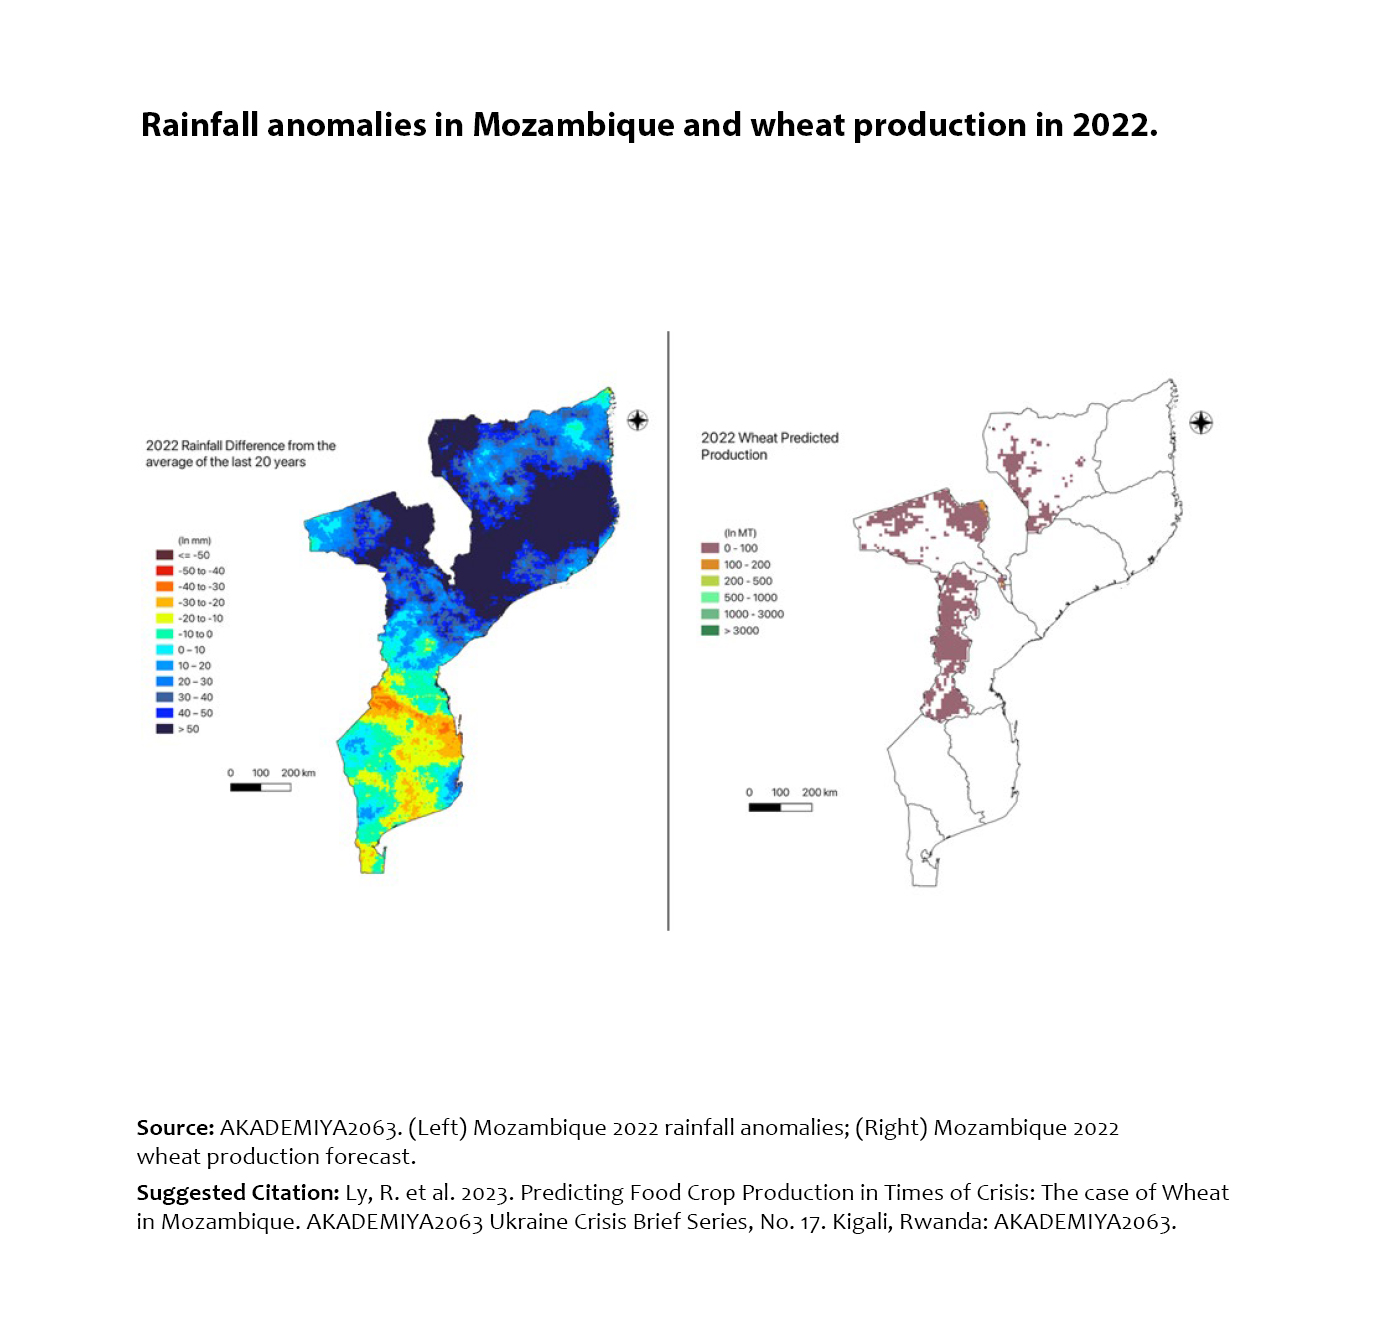
Rainfall anomalies in Mozambique and wheat production in 2022
Rainfall anomalies in Mozambique and wheat production in 2022
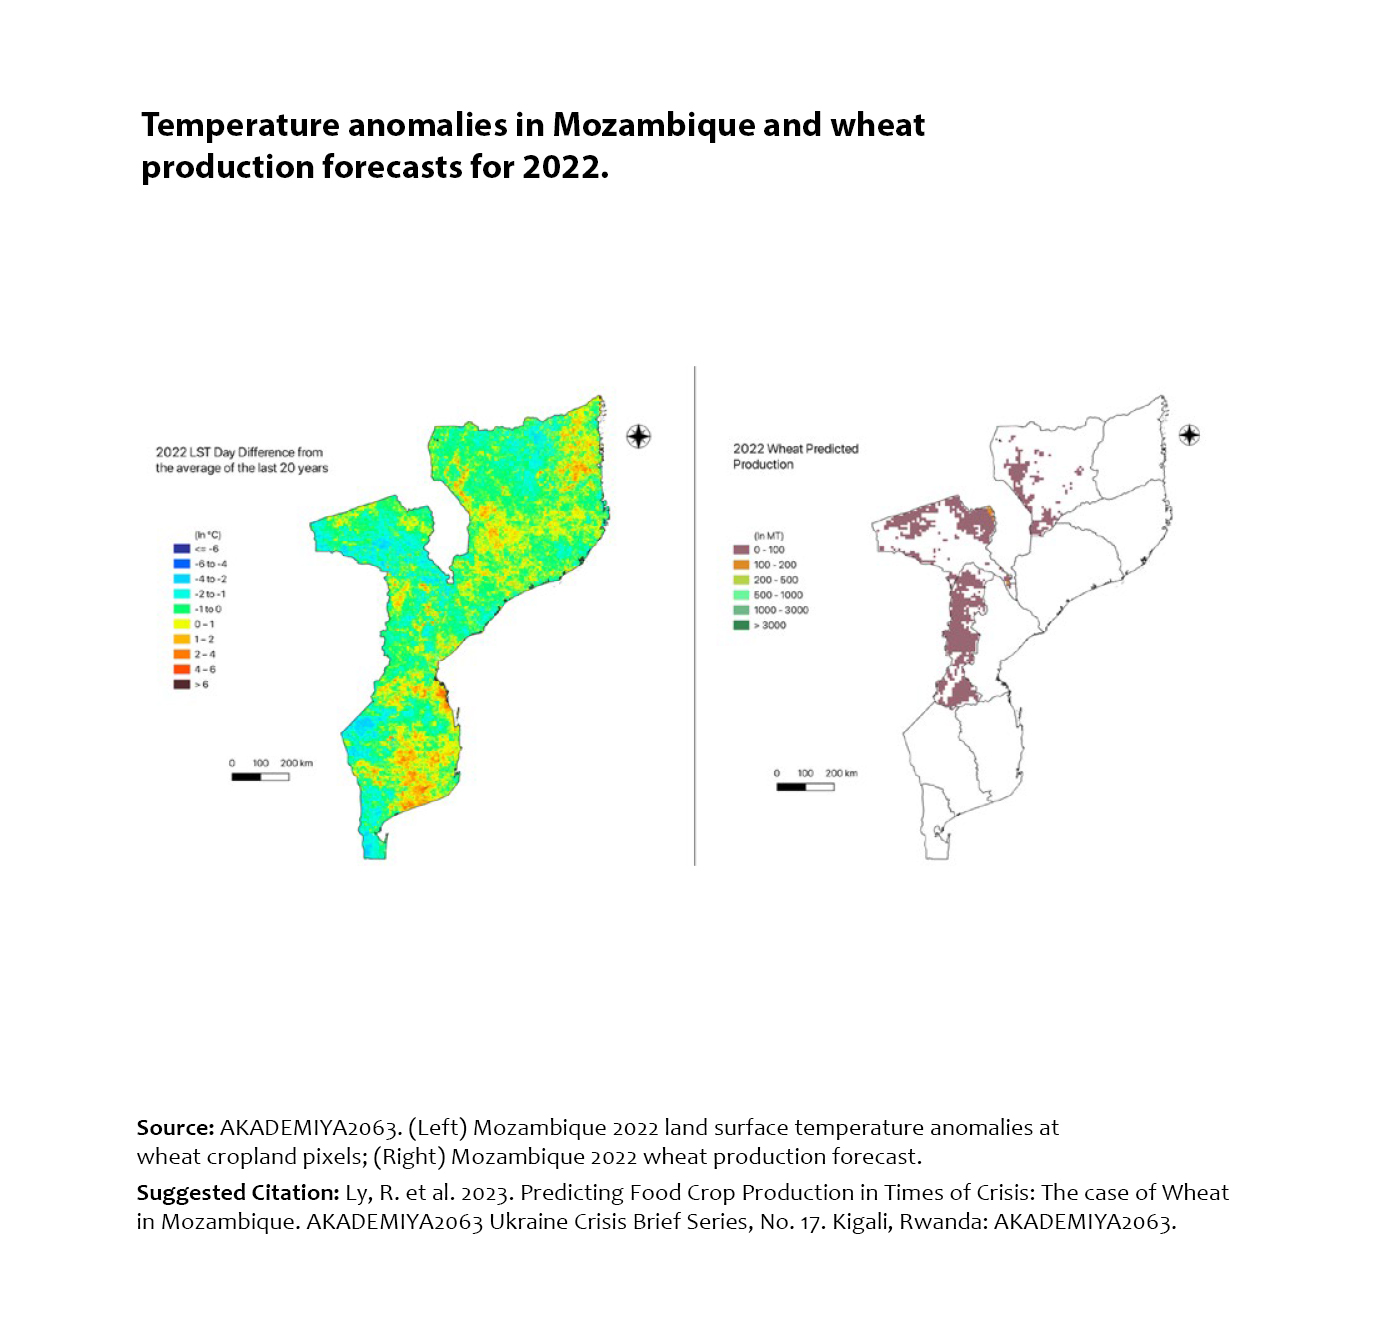
Temperature anomalies in Mozambique and wheat _production forecasts for 2022
Temperature anomalies in Mozambique and wheat _production forecasts for 2022
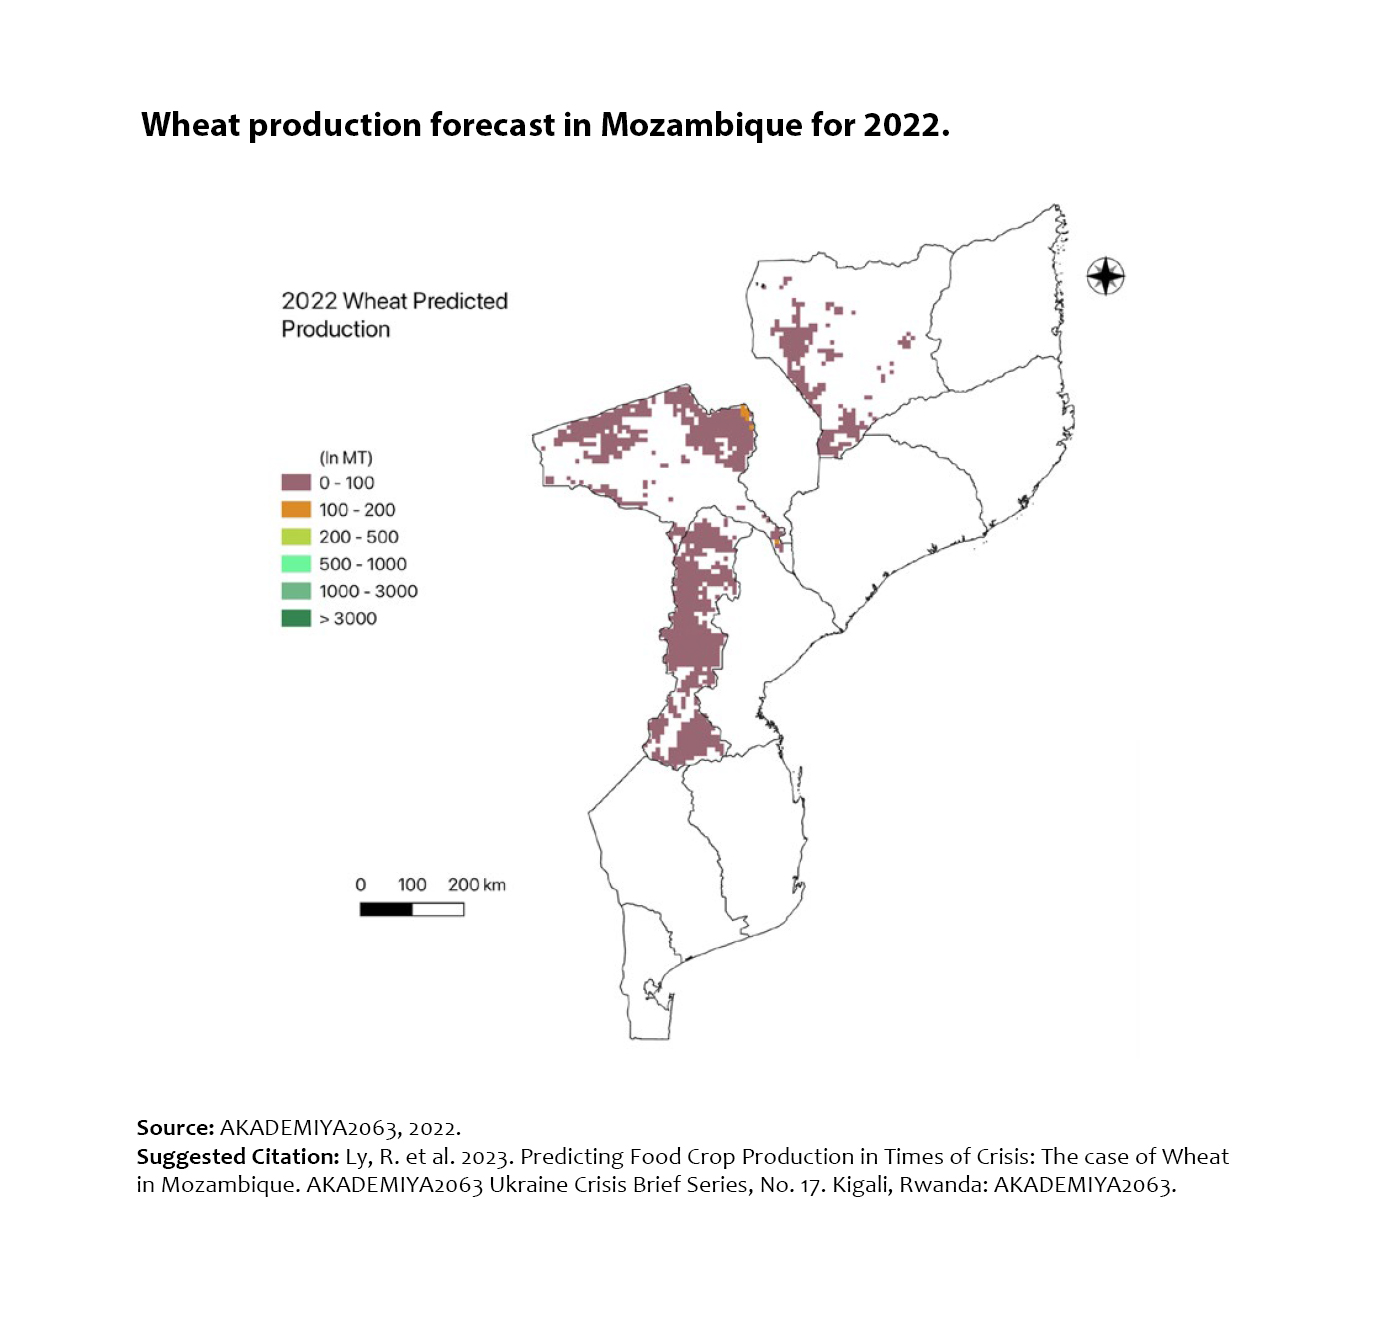
Wheat production forecast in Mozambique for 2022
Wheat production forecast in Mozambique for 2022
Fertilizer Use by Type of Crop in Uganda, Percentage Changes
Fertilizer Use by Type of Crop in Uganda, Percentage Changes
Fertilizer Use Share by Crop Type, Uganda

Fertilizer Use Share by Crop Type, Uganda
NDVI anomalies in Mozambique and wheat production forecast for 2022
NDVI anomalies in Mozambique and wheat production forecast for 2022
Output Effects in Uganda, Percentage Changes Ukraine

Output Effects in Uganda, Percentage Changes Ukraine
Weekly energy prices in Bungoma Market (Jan-Jun 2022)
.jpg)
Weekly energy prices in Bungoma Market (Jan-Jun 2022)
Weekly energy prices in Kangemi market, Nairobi (Jan-Jun 2022)
.jpg)
Weekly energy prices in Kangemi market, Nairobi (Jan-Jun 2022)
Weekly energy prices in Kirinyaga market (Jan-Jun 2022)
.jpg)
Weekly energy prices in Kirinyaga market (Jan-Jun 2022)
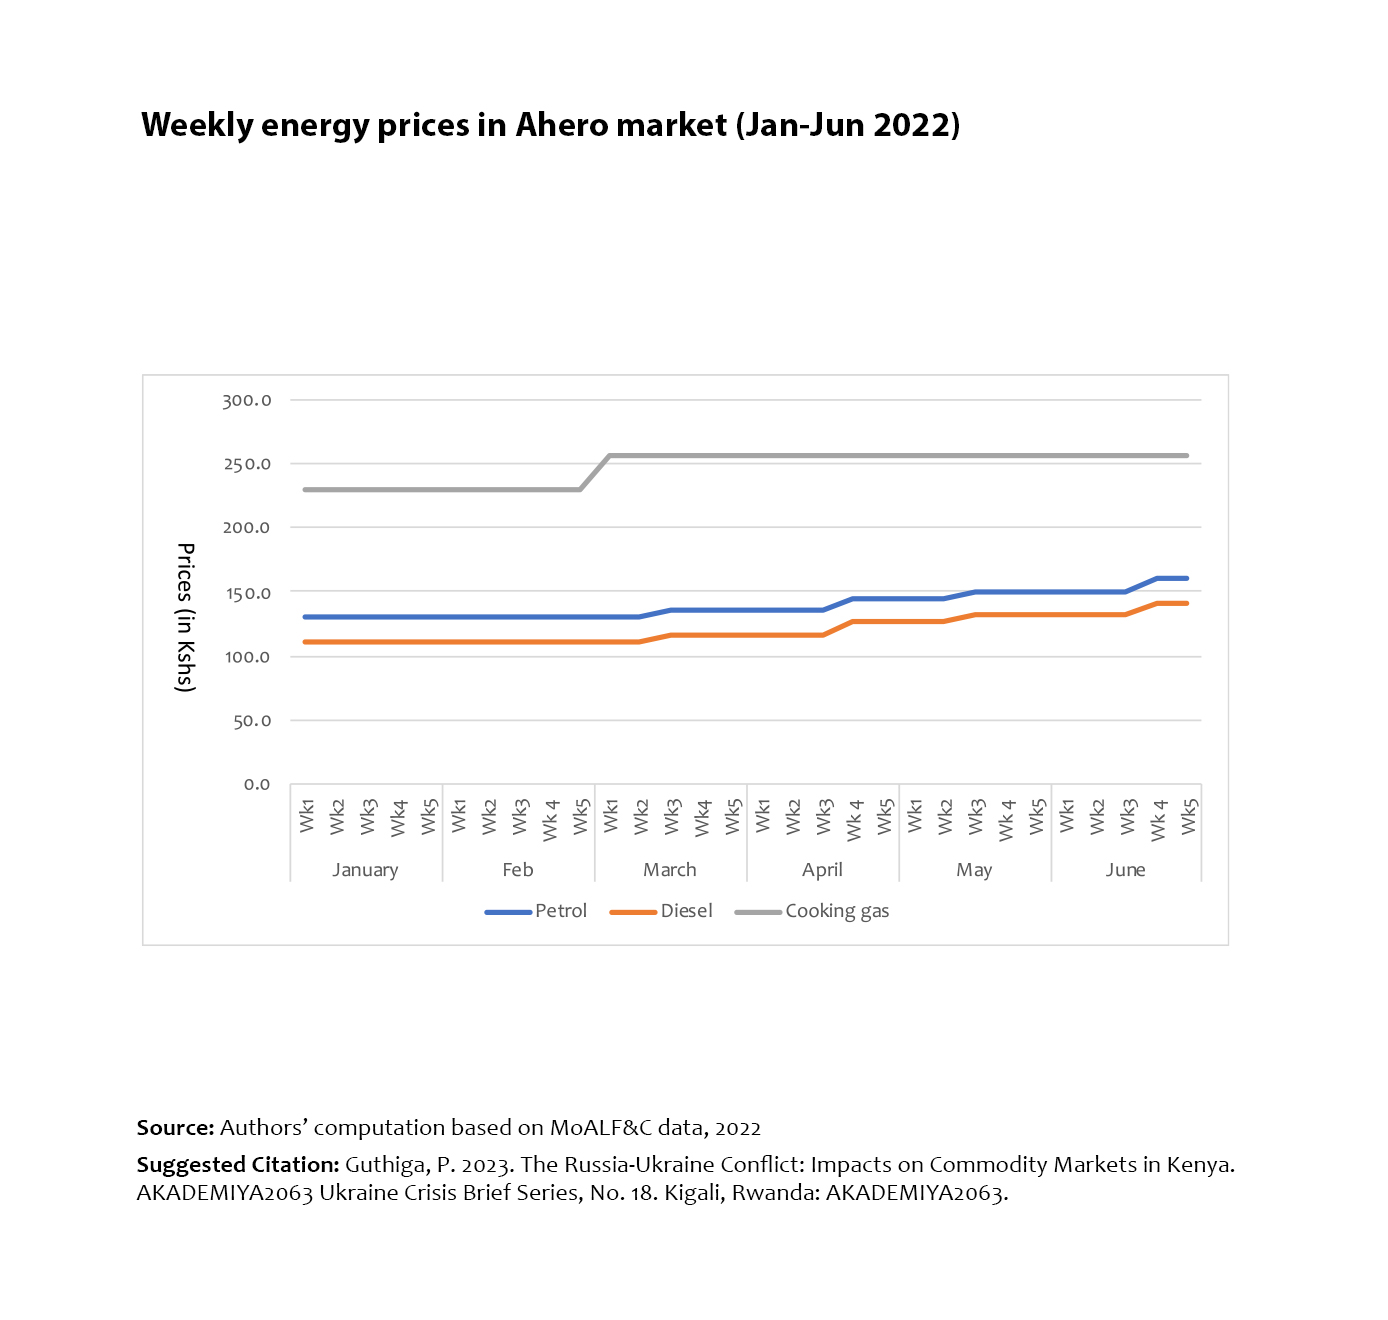
Weekly prices of food commodities in Ahero market, Kisumu _(Jan-Jun 2022)
.jpg)
Weekly prices of food commodities in Ahero market, Kisumu _(Jan-Jun 2022)
Weekly prices of food commodities in Bungoma (Jan-Jun 2022)
.jpg)
Weekly prices of food commodities in Bungoma (Jan-Jun 2022)
Weekly prices of food commodities in Kangemi market, _Nairobi (Jan-Jun 2022)
.jpg)
Weekly prices of food commodities in Kangemi market, _Nairobi (Jan-Jun 2022)
Weekly prices of food commodities in Kirinyaga (Jan-Jun 2022)
.jpg)
Weekly prices of food commodities in Kirinyaga (Jan-Jun 2022)
Monthly prices (UGX) of food commodities in Gulu (Jan-May 2022)
 of food commodities in Gulu (Jan-May 2022).jpg)
Monthly prices (UGX) of food commodities in Gulu (Jan-May 2022)
Monthly prices (UGX) of food commodities in Mbale market (Jan-May 2022)
 of food commodities in Mbale market (Jan-May 2022).jpg)
Monthly prices (UGX) of food commodities in Mbale market (Jan-May 2022)
Monthly prices (UGX) of food commodities in Mbarara (Jan-May 2022)
 of food commodities in Mbarara (Jan-May 2022).jpg)
Monthly prices (UGX) of food commodities in Mbarara (Jan-May 2022)
Weekly energy prices in Kampala (Jan-Jun 2022)
.jpg)
Weekly energy prices in Kampala (Jan-Jun 2022)
Weekly prices (UGX)3 of food commodities in Kampala (Jan-Jun 2022)
3 of food commodities in Kampala (Jan-Jun 2022).jpg)
Weekly prices (UGX)3 of food commodities in Kampala (Jan-Jun 2022)
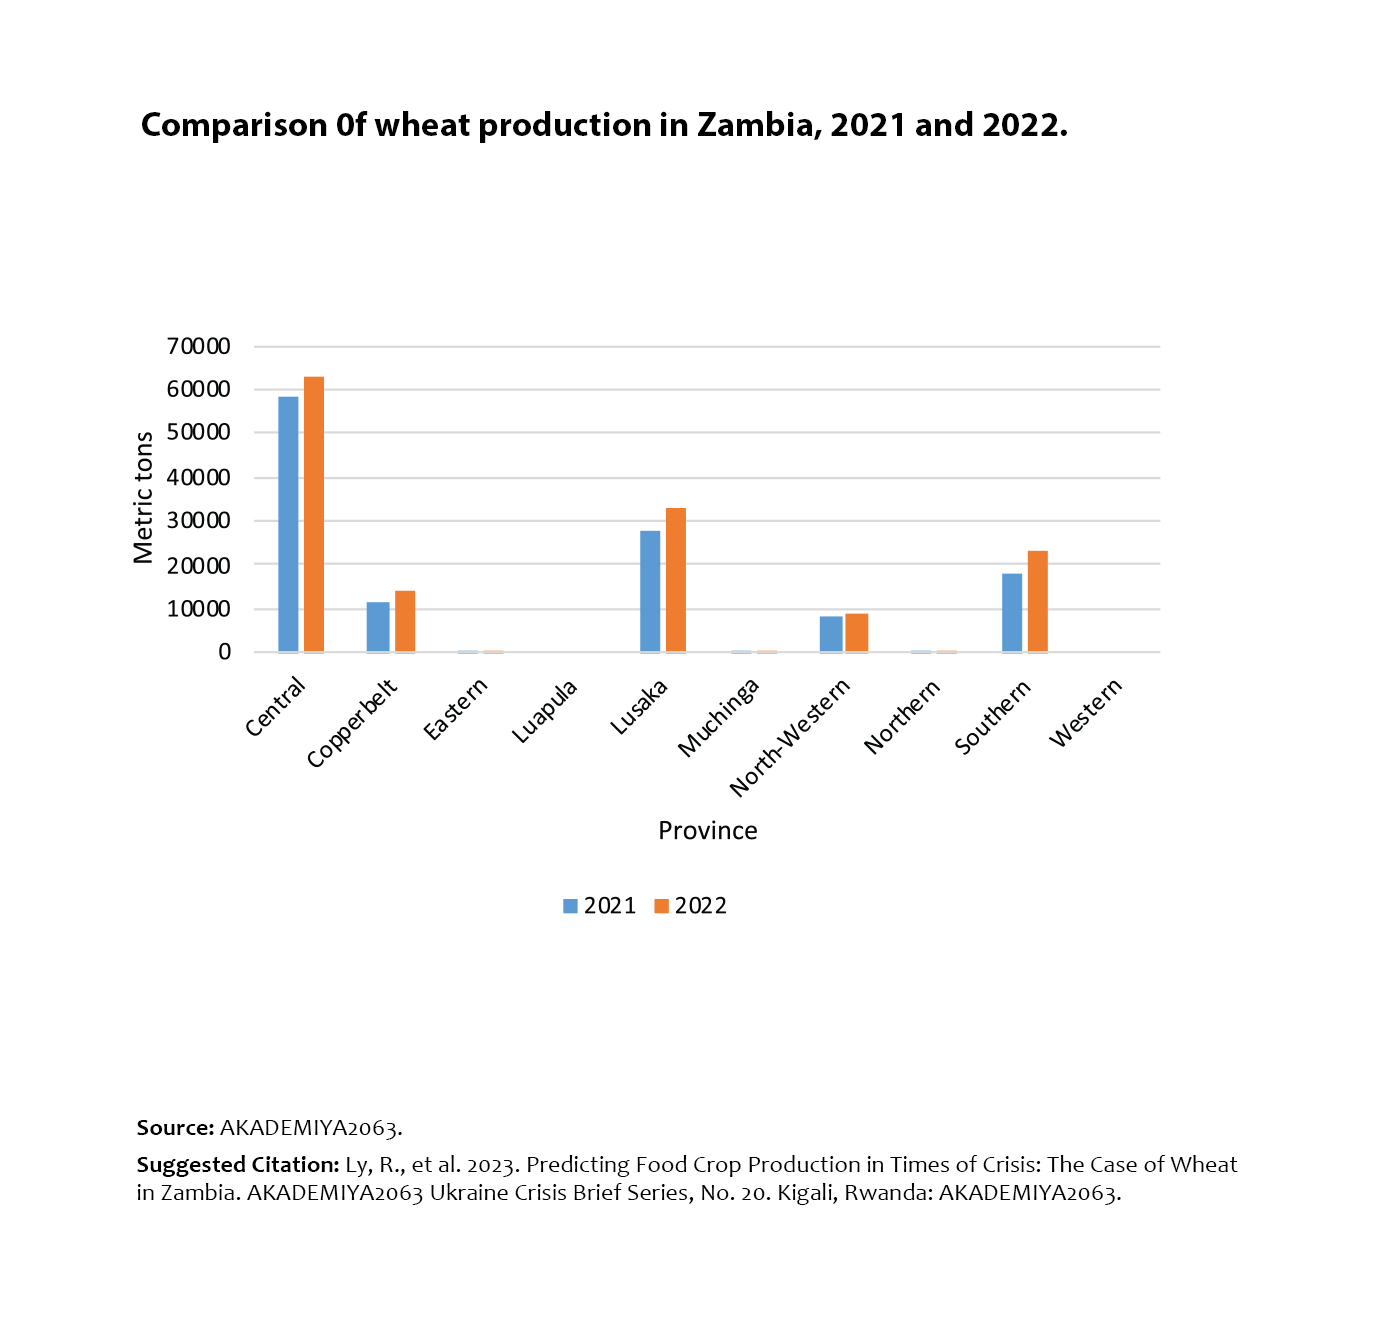
Comparison 0f wheat production in Zambia, 2021 and 2022
Comparison 0f wheat production in Zambia, 2021 and 2022
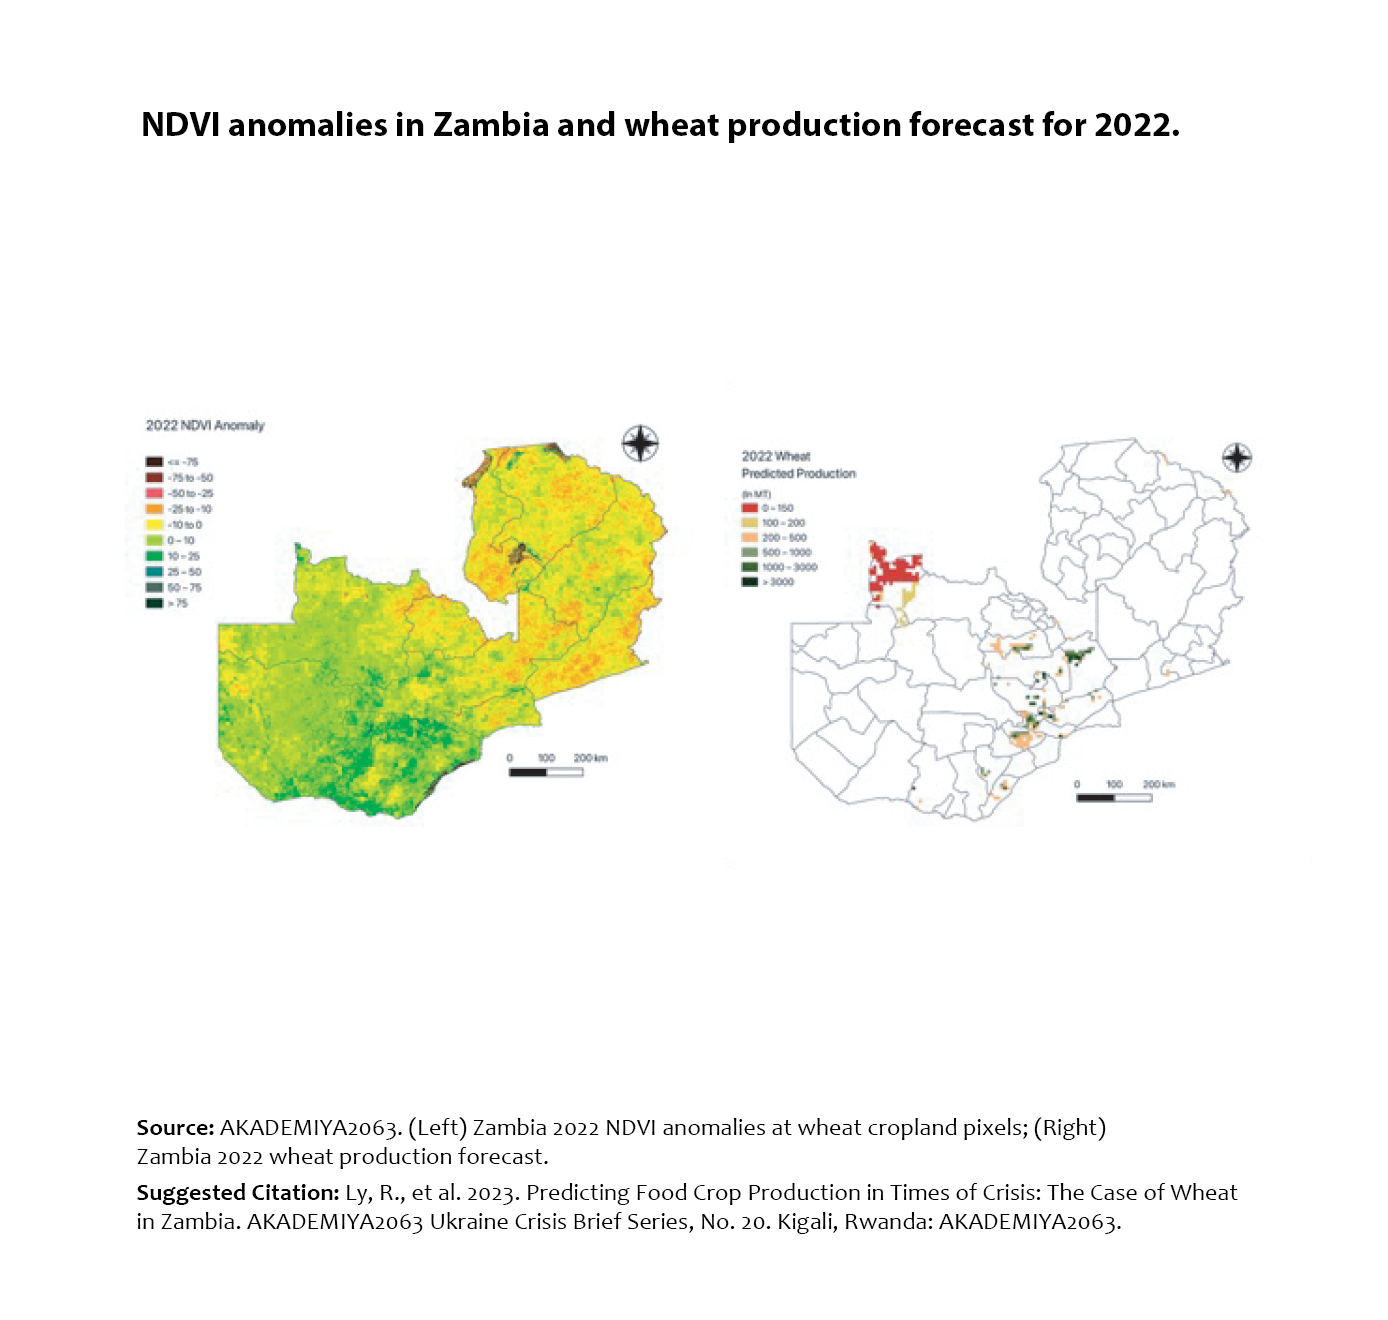
NDVI anomalies in Zambia and wheat production forecast for 2022
NDVI anomalies in Zambia and wheat production forecast for 2022
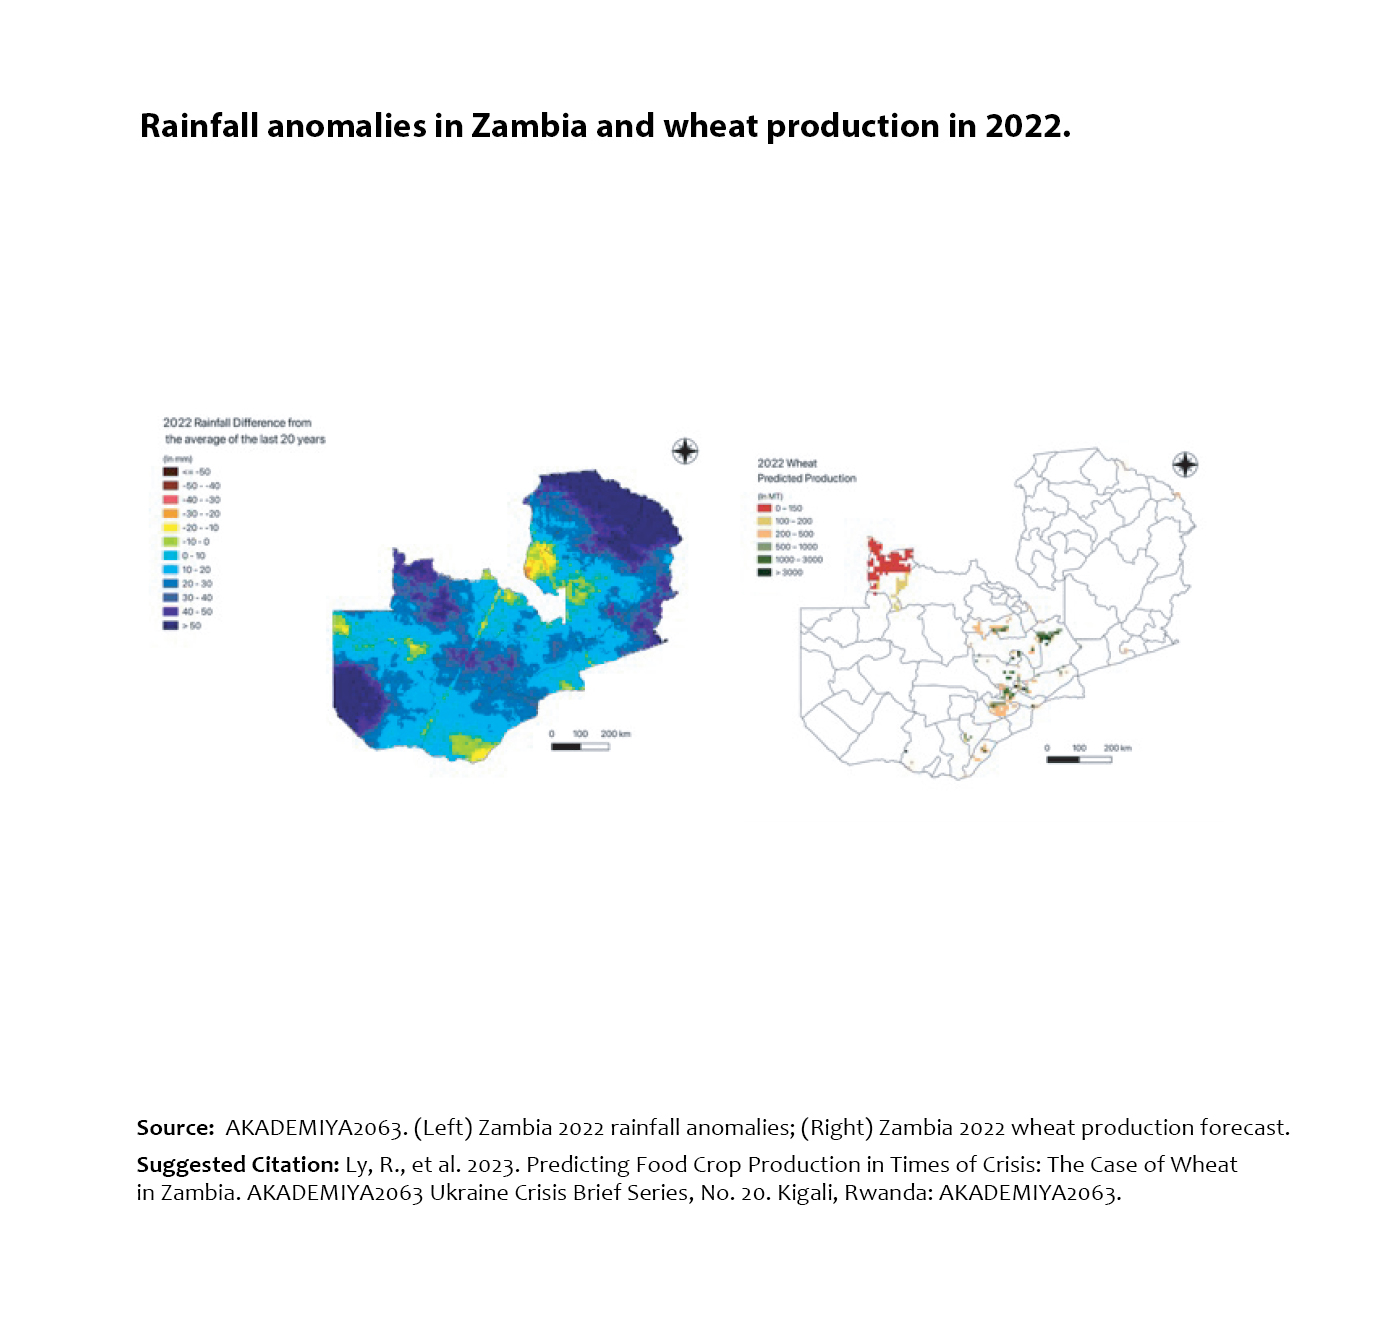
Rainfall anomalies in Zambia and wheat production in 2022
Rainfall anomalies in Zambia and wheat production in 2022
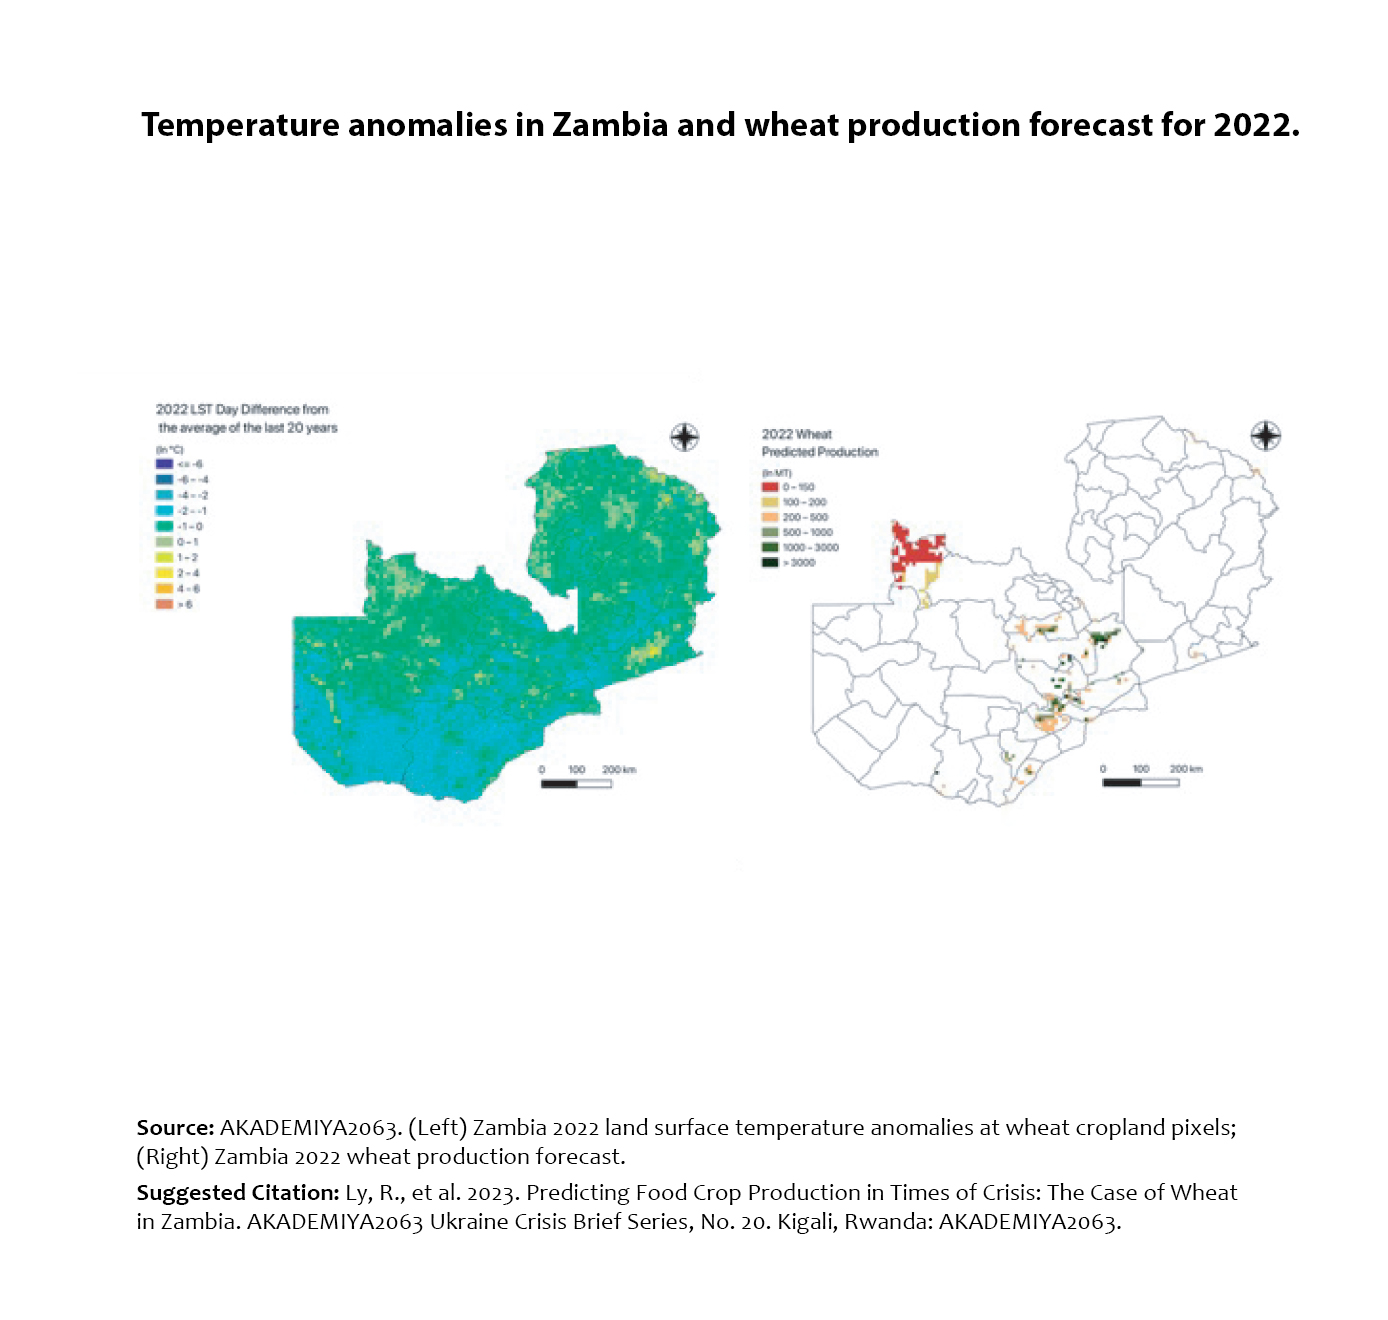
Temperature anomalies in Zambia and wheat production forecast for 2022
Temperature anomalies in Zambia and wheat production forecast for 2022
Wheat production forecast in Zambia for 2022
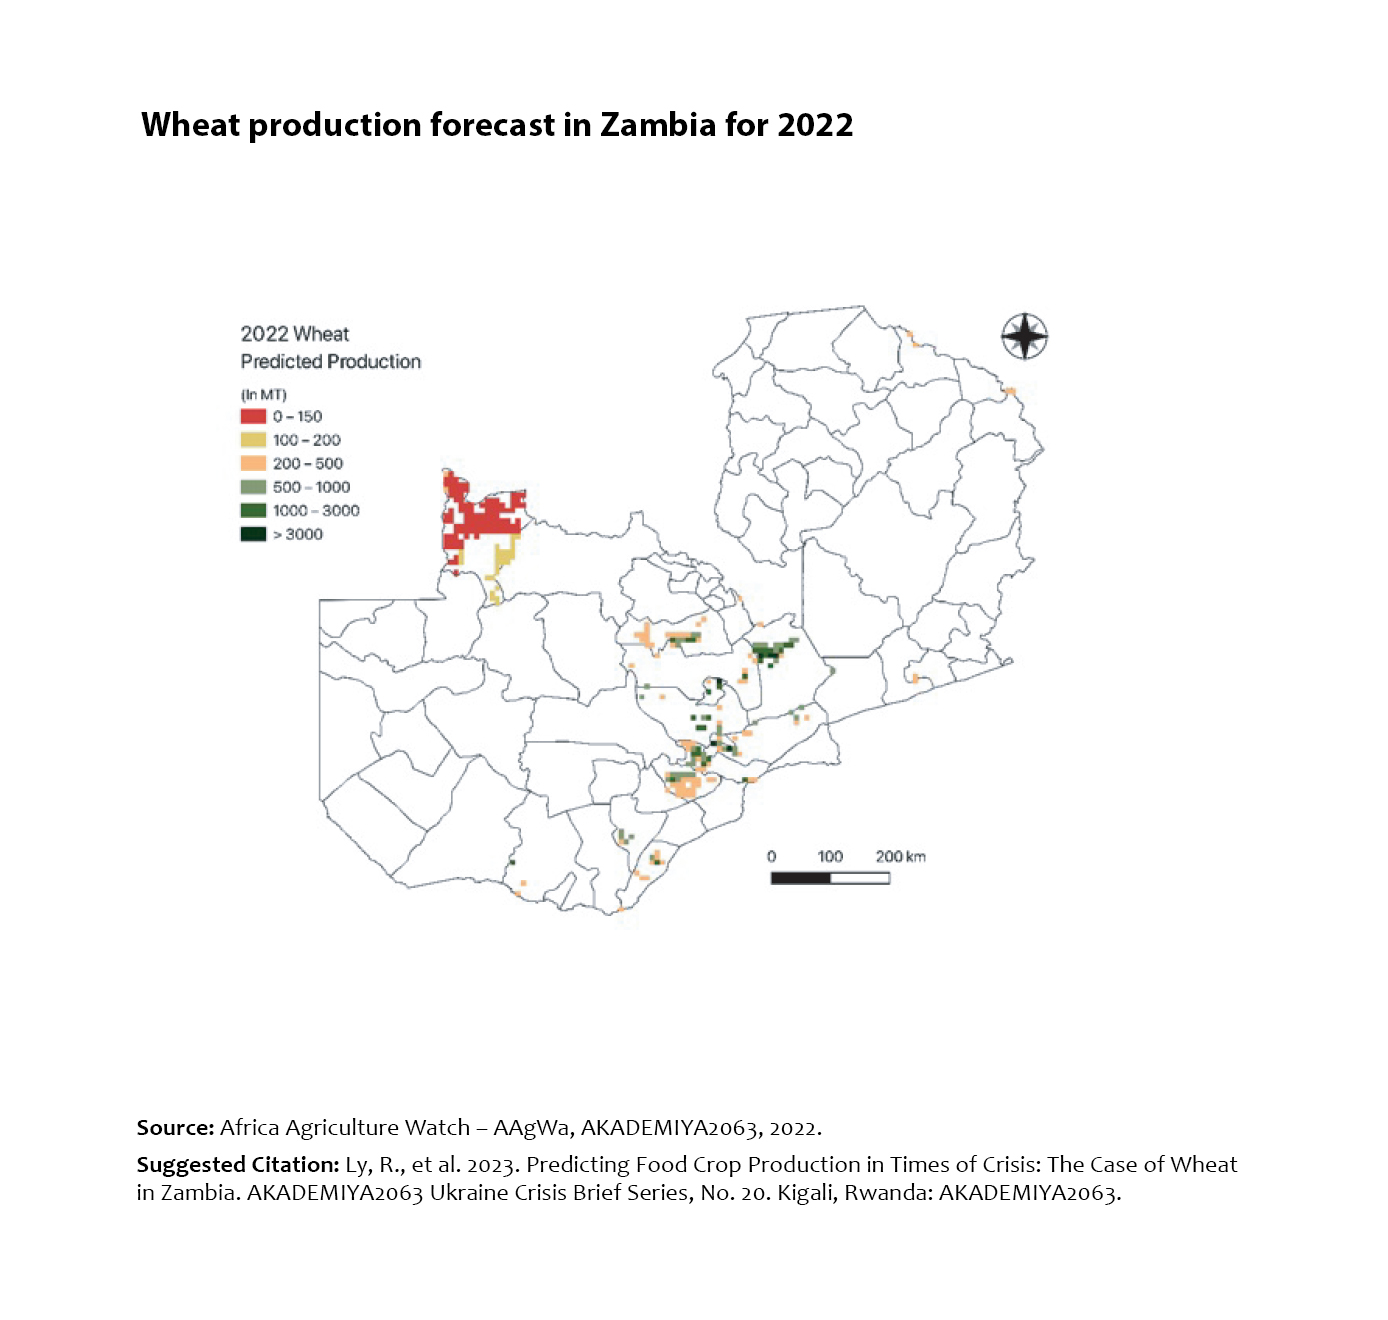
Wheat production forecast in Zambia for 2022
Projected Changes in Global Commodity Prices before and after the onset of the Ukraine
Crisis
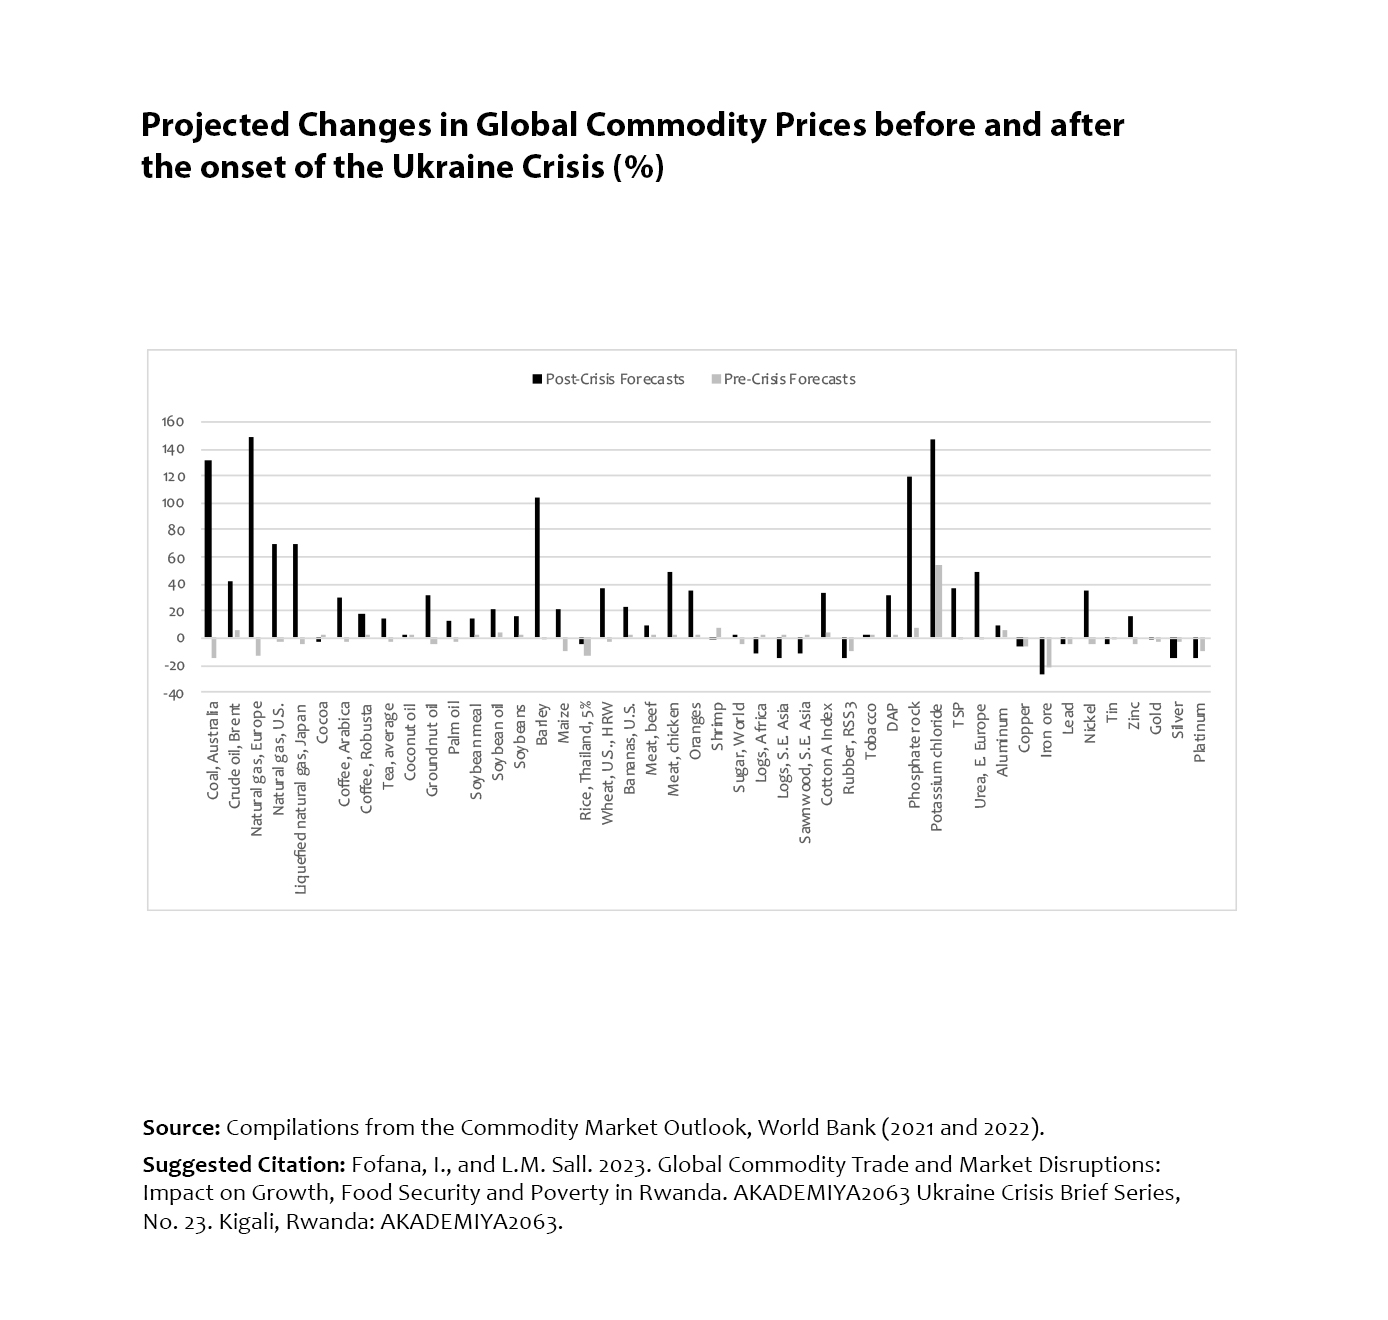
Projected Changes in Global Commodity Prices before and after the onset of the Ukraine Crisis
Webinaires
Aperçu

Prochain webinaire
Webinaires passés
Impacts on Commodity Markets in Zimbabwe
Exposure and Vulnerability to Global Wheat and Vegetable
Oils Trade and Market Disruptions: Case Study of Malawi
Exposure to Global Commodity Trade and Market
Disruptions: Impacts on Growth, Poverty and Food Security in Malawi
Impacts on Commodity Markets in Uganda
Impacts on Commodity Markets in Mozambique
Global Fertilizer and Wheat Trade and Market Disruptions:
Impacts on Agricultural Productivity, Growth, and Food Security for Rwanda
Impacts on Commodity Markets in Kenya
Transmission of Global Price Shocks to Local Commodity
Markets in Malawi
Transmission of Global Price Shocks to Local Commodity
Markets in Rwanda
Opportunities and Potential for the Expansion of Regional
Food Trade
Vegetable Oils Market Disruptions: Income and Food
Security Effects
Predicting Food Crop Production in times of Crisis: The
Case of Wheat in South Africa
Wheat Sector Disruptions: Exposure, Contagion, and
Effects on Income and Food Security
Fertilizer Sector Disruptions: Exposure, Contagion, and
Effects on Agricultural Productivity and Growth
Terms of Trade: Impacts on Growth, Employment, Poverty,
and Food Security
Impacts and Policy Implications on Trade, Growth,
Poverty, Food Security, and Employment
Partenariats
AKADEMIYA2063 is supported financially by the United States Agency for International Development (USAID), the Bill and Melinda Gates Foundation (BMGF), the German Federal Ministry for Economic Cooperation and Development (BMZ), the African Development Bank (AfDB), the UK’s Foreign, Commonwealth & Development Office (FCDO), the Global Center on Adaptation (GCA), and the Food and Agriculture Organization of the United Nations (FAO). The views expressed in these publications do not necessarily reflect those of the funders.
Map Disclaimer
The designations and presentations of the material on the various maps do not imply the expression of any opinion whatsoever on the part of AKADEMIYA2063 on the legal status or delimitation/frontiers/boundaries of any country, territory, city or area. The depiction and use of boundaries, geographic names, and related data shown on maps are not warranted to be error-free, nor do they imply official endorsement or acceptance by AKADEMIYA2063.
Menu
Siège d’AKADEMIYA2063
Bureau Régional pour l'Afrique de l'Ouest et du Centre
© AKADEMIYA2063 2026